Brand perception survey: what people say vs what they select
Written by


Ask people what comes to mind when they think of Labubu and they volunteer "creepy", "ugly", "unsettling" and "scary teeth". Yet, show the same people a fixed list of attributes and the doll wins one of them by a landslide: "is trendy".
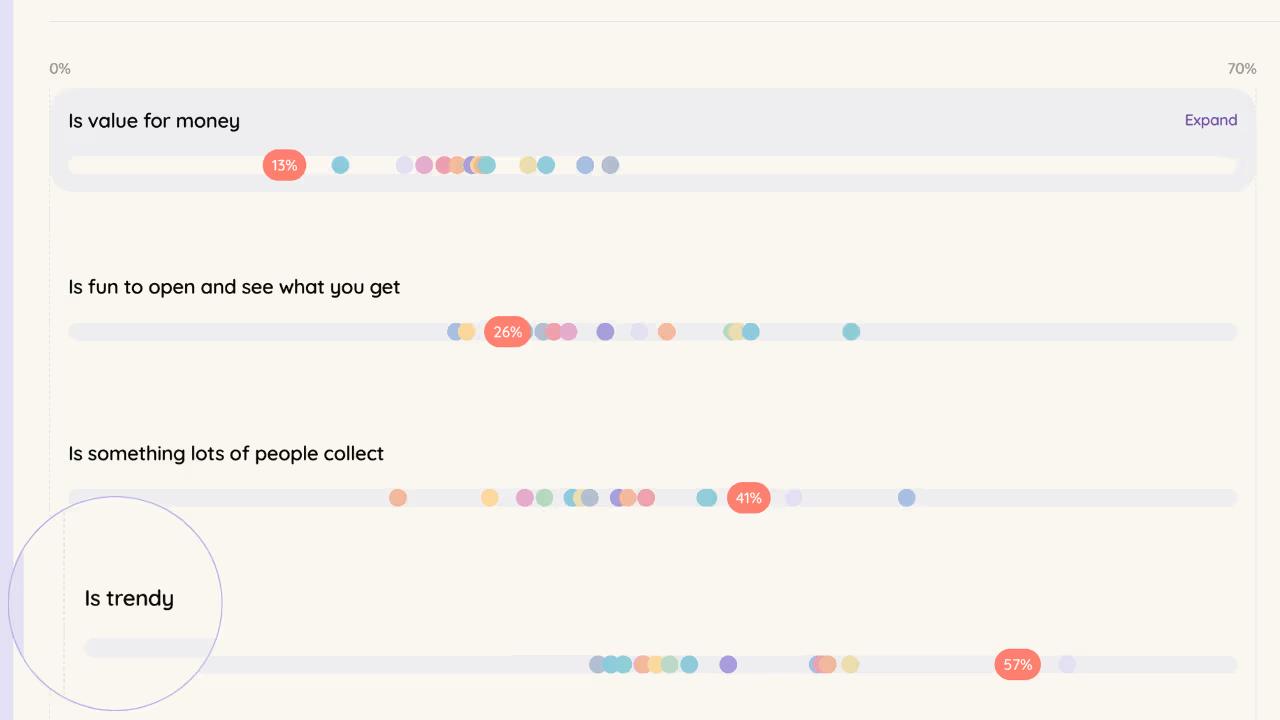
This all comes from the same brand and the same survey, but gives two completely different answers. And even more perplexing? Both of them are true.
This is a great example of why brand perception surveys need two components: “what comes to mind” and “what do you agree with.” A survey that runs only unaided associations, or only aided attribute selection, reads half its own data. If every attribute in your tracker scores well but nobody can explain why the brand still feels invisible, this is probably why.
The gap between what people volunteer about your brand and what they'll agree to when shown a list is the most useful number in the whole study, and plenty of brands never calculate it.
What a brand perception survey measures (and the two instruments inside it)
A brand perception survey is a structured study that asks category buyers what they associate with your brand and its competitors, using two instruments:
- Unaided associations, where nothing is shown and people answer in their own words
- Aided questions, where people select which attributes they associate with each brand from the same fixed list
The standard setup surveys around 1,000 category-qualified respondents, meaning people who actually buy in your category. That zoomed-in audience makes the results more relevant and actionable, and more likely to show real movement, than a diluted read of the general population.
Perception questions then go only to people aware of each brand, so the base behind any one brand's results is smaller than the full sample.
And here's why the unaided half matters more than most brands assume. Show the average American shopper a full list of brands in the US Baby and Child Products category, and they're aware of three of them, but will only consider two.
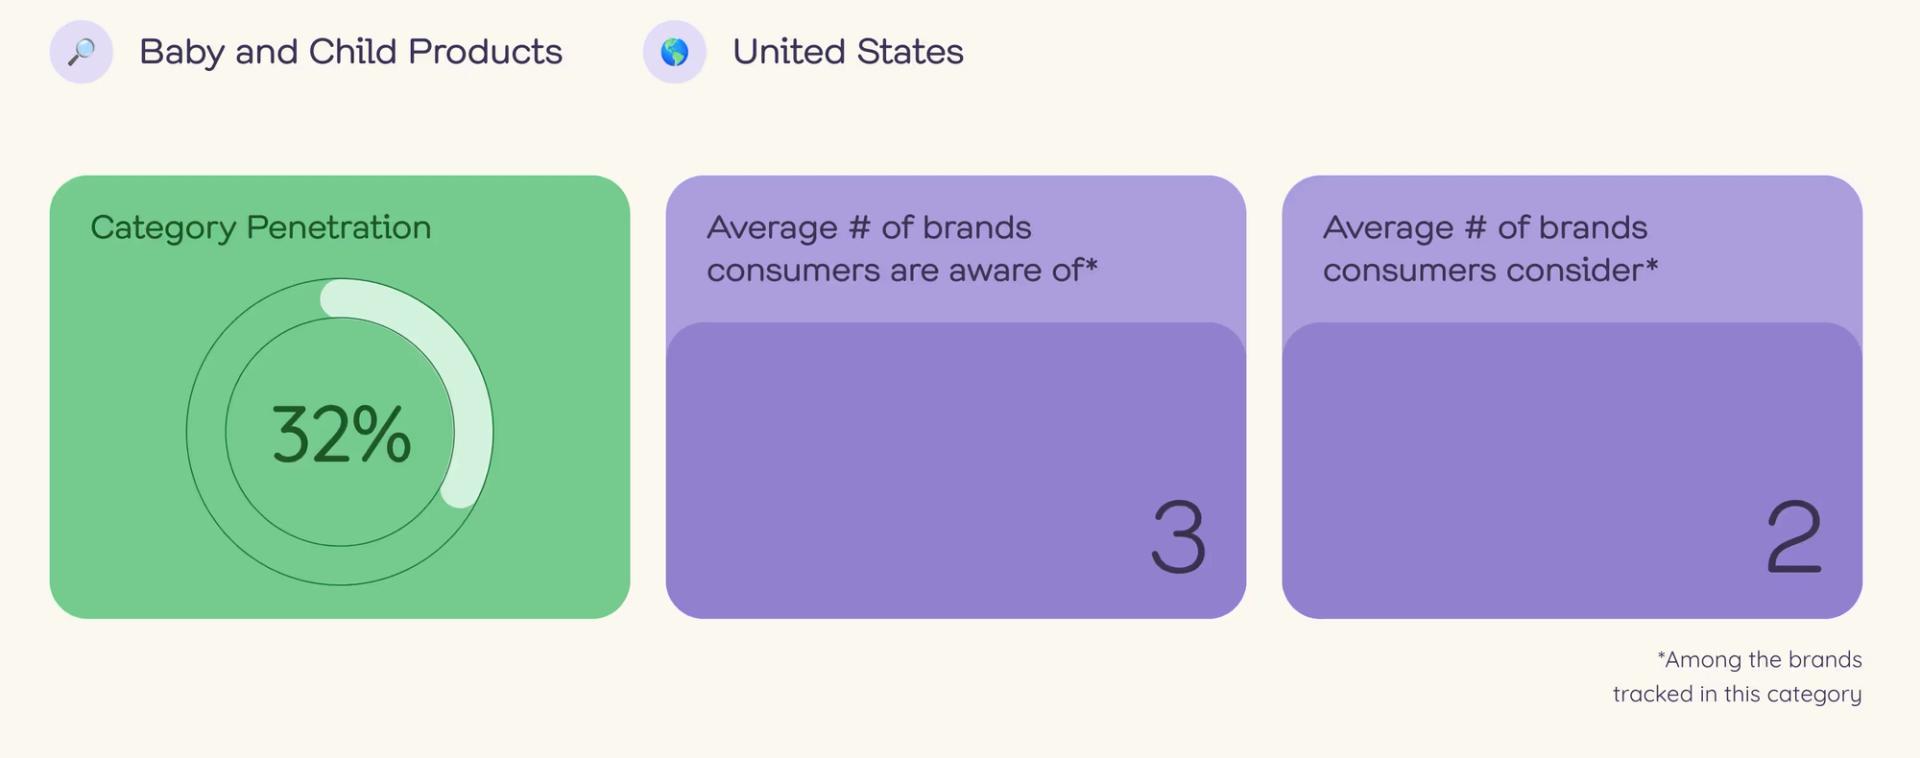
Note: Tracksuit's data has found that 92% of categories have fewer than three brands in the consumer's consideration set, so that shortlist isn't a quirk of one category.
To get onto a list that short, a brand has to be retrieved from memory (not recognized from a list someone hands you), and the unaided question is the only one measuring retrieval. Which makes it less of a curiosity and more of a revenue question.
The two instruments (unaided and aided) inside that survey do different jobs, and we built both into Tracksuit to cover both.
Imagery is the unaided association
Respondents answer "what comes to mind when you think of [your brand]?" with nothing shown to them first, and the verbatim answers get coded into themes, split into common themes (shared with your competitors) and unique themes (yours alone).
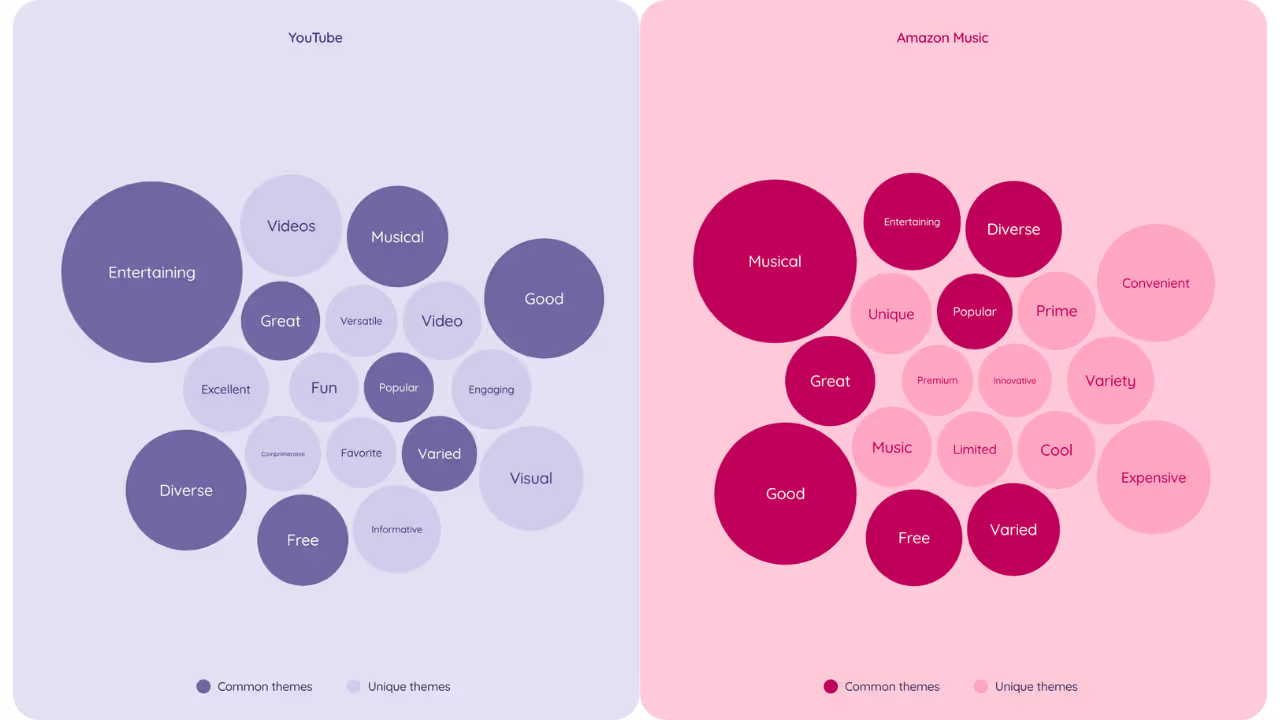
Statements are aided associations
Respondents are shown a set of statements and select the ones they associate with your brand and each competitor. Brands choose those statements themselves, usually with our guidance, and they can span category entry points, functional benefits and emotional associations. The metric is the share of people shown each statement who selected it.
If you want the short version of why this split matters, we wrote about asking your buyers directly rather than guessing from the boardroom.

In short, unaided tells you which associations are most salient, while aided gives you a comparable read against competitors, with the caveat that showing people a list nudges them toward selecting (and neither can do the other's job).
Labubu scored bottom two on nearly everything and still owned "trendy"
In our US Collectible Figurines survey, Labubu sits at 30% awareness, around 27.4 million people, behind only Funko Pop! (56%) and L.O.L Surprise! (41%). Respectable company for a gremlin that only joined Pop Mart in 2019, and we've dug into why Labubu took off separately.
Now look at what the two instruments say about that awareness.
The unaided Imagery answers lead with price ("expensive", "pricey", "overpriced"), and beside them sit "creepy", "ugly", "unsettling" and "scary", along with a few kinder words like "stylish" and "fashionable".

And the aided Statements grid agrees with the mob in six of the seven attributes. Of the people aware of Labubu, the brand ranks bottom two on "makes me feel happy when I see it", "is for people like me", "is a fun brand", "is a brand I trust", "is something fun to collect over time" and "helps express what I'm into".

What about the seventh attribute? On exactly one statement, “is trendy,” Labubu wins by a landslide, and it’s one of the clearest examples of why one instrument can't do the other's job.
A doll can be despised on six attributes and dominate the seventh with both readings being correct because they're measuring different things. The unaided answers tell you what's salient, while the aided grid tells you what's comparable.
A survey running only the unaided question would conclude Labubu has a perception crisis. And a survey running only the aided grid would conclude it's a weak brand with one lucky attribute. The full read says something stranger but far more useful: the brand completely owns "trendy," and in this category that's the only attribute it needed to win.
Four patterns to look for when the two instruments disagree
The interesting moments in a brand perception survey are almost never the scores themselves, but the disagreements between them. Each one points to a different decision, so it pays to know the patterns by name.
Volunteered, not agreed
- What you see: An association appears unaided but sits low on your statement list
- What it means: It's in people's heads and your grid never asked about it
- What to do: Decide if it's a distinctive asset to build on or a liability to manage, then track it and run drivers analysis to see whether it moves brand health
Agreed, never volunteered
- What you see: An attribute scores well but nobody mentions it unaided
- What it means: The attribute is true but not salient; you get respect but no recall
- What to do: Run drivers analysis to see if it matters in the category; if it does, work to make it salient
Common theme vs unique theme
- What you see: Your unaided themes mostly overlap with competitors'
- What it means: Some common themes are hygiene factors you need just to be a contender; on their own, they don't give you a position
- What to do: Hold the hygiene factors, then put budget behind a unique association that matters to category buyers and is underserved by competitors
High among users, low among non-users
- What you see: An aided association splits sharply between users and non-users
- What it means: Not necessarily a perception problem. Non-users may know the attribute well and be choosing not to buy
- What to do: Check where non-users drop off in the funnel before choosing between trial-driving activity and brand spend
The third pattern is one we should point out specifically, because it’s where the “common versus unique” split earns its keep.
Common themes are table stakes, the things everyone in the category gets associated with (a brand has to be associated with them just to be a contender, and ideally they show up for you and your competitors alike).
Unique themes are what you actually own. If your unaided associations are only ever common, you've earned a place in the category but not a position in it, and you're paying rent on someone else's position (this is also where brand growth benchmarks stop being a nice-to-have, because "distinctive" only means anything relative to your category).
And gaps like these exist at scale whether or not you're looking.
Edelman's 2026 Trust Barometer Special Report on Brands, opens in new tab surveyed 17,688 people across 15 countries and found that relevance now runs across five dimensions (utility, identity, community, emotional connection and pop culture), with most brands falling short on all of them.
This means you’re left with five ways to be irrelevant, and a single-instrument survey can't tell you which one you're failing.
Reading the gap over time rather than in a single wave
Perception moves, but it usually moves in small steps, which is why a single annual read can miss it. A one-off study gives you a position, but a repeated read of your Statements gives you a direction. Imagery works differently. It's best read periodically, as a picture of what's salient right now, rather than as a line that moves month to month.
This is why you could argue that cadence matters more than the sample size (though sample size matters too: cut it too far and you're reading noise instead of signal). Reading your Statements across waves (each repeat of the survey) on a rolling average, and refreshing your Imagery read periodically, is what turns two instruments into a diagnostic instead of a snapshot, and it's the practical difference between ad hoc and always-on brand tracking.
None of which makes the slow read a soft one. Edelman's 2026 Trust Barometer, opens in new tab found 88% of people say “trusting a brand” is an important purchase factor, nearly equal to “quality” at 89% and fully equal to “value” at 88%.
That means perception is more than a sentiment score sitting beside the commercial metrics. It's one of the three things people actually buy on, which makes it pricing power, and pricing power is the one number your CFO reads to the end.
(If you're heading into that meeting, we've written about how to answer the CFO question.)
What to do with the answer you get back
If you've sat in a readout where every attribute scored respectably and nobody in the room could explain why the brand still felt invisible in the category, it's probably because your brand perception survey only ran the aided half.
But remember, agreement isn't the same as being remembered.
The fix is a survey with both questions in it, asked alongside your funnel questions so you can see where perceptions drop off, with Statements repeated often enough to see movement, read against your competitor set. This is the whole premise behind continuous brand tracking: the aided grid tells you whether you're keeping up, and the unaided answers tell you whether you exist in the consumer’s mind at all.
Labubu, as you know, exists. Sure, it’s creepy, ugly, scary teeth… but it’s also first by a mile on the only attribute it needs. That little gremlin knows exactly what it owns. A brand perception survey with both instruments running is how you find out whether you do, too.
Frequently asked questions
What is a brand perception survey?
A brand perception survey measures how people think and feel about your brand, using two different question types: unaided (what comes to mind without any hints) and aided (selecting from a specific list of attributes). Most teams run only one of these and mistake it for the whole picture. Our Labubu data shows why that's a problem: the same brand can score badly on unaided associations ("creepy," "ugly") and still dominate an aided attribute like "is trendy." Ask both alongside your brand funnel questions and you can also see where those perceptions drop off.
What's the difference between unaided and aided brand perception questions?
Unaided questions ask "what comes to mind when you think of this brand?" with nothing shown to the respondent, revealing what's top of mind, along with emerging trends and the associations people see as category requirements. Aided questions show a fixed list of statements or attributes and ask people to select the ones they associate with each brand. In Tracksuit's product, these live as Imagery (unaided) and Statements (aided), and they're built to disagree with each other on purpose.
How many people do you need to survey for a brand perception survey?
Around 1,000 category-qualified respondents per category is the standard setup, and it gives most mid-market brands enough workable precision to read subgroups without the numbers turning into noise. Perception questions only go to people aware of each brand, though, so the base behind any single brand's results varies and will be smaller than 1,000. The important part isn't the headline number. It's that those respondents are screened as actual category buyers first. A thousand people who don't buy in your category will give you a clean-looking result that means nothing.
How often should you run a brand perception survey?
You can run it periodically, but the more often you measure, the more clearly you can connect movement to specific activity across the year. Statements are the half built for this, read period-over-period on a rolling average, because a single wave (one run of the survey) just gives you a position instead of a trend.
Who should you survey: customers, category buyers, or both?
Category buyers, not just your existing customers. Surveying only people who already use your brand tells you nothing about the much larger pool who don't, and that pool is where most of your growth sits. Tracksuit's own methodology flags this directly. Associations often differ between people who've used a brand and people who are merely aware of it, and that gap isn't necessarily a perception problem: non-users may know the brand well and be choosing not to buy.
What questions should a brand perception survey include?
Both an unaided "what comes to mind" question and an aided statement list covering functional benefits, emotional associations, and category entry points (the moments that trigger someone to think of your category at all). Run unaided first, always, since showing a list of brands contaminates recall for everything that follows.
How is a brand perception survey different from brand awareness tracking?
Brand awareness tracking asks whether people have heard of you; a brand perception survey asks what they think once they have. Labubu proves the split matters: awareness sits at 30% in the US Collectible Figurines category, around 27.4 million people, but that awareness comes alongside bottom-two scores on trust and likability. You can be known and still poorly regarded, which is exactly what perception data catches and awareness data can't.
What does it mean if people select your brand for an attribute but never mention it unaided?
It means the attribute is true but not salient, a respectable score with zero cut-through. People will pick your brand as reliable or trustworthy when you hand them the word, but it never surfaces on its own, which is a distribution problem for that association, not a false one.