Stratified sampling vs quota sampling for brand tracking
Written by


You're researching the best way to measure brand awareness, and you come across two trackers, each with their own methodology pages but neither of them particularly helpful. One says "stratified sampling," and the other says "quota sampling with post-stratification weighting."
And here you are simply wanting to know whether the numbers you get back will actually reflect your category.
Accurately measuring brand health is difficult if you don’t collect a consistent sample, and it’s flawed if that sample doesn’t reflect a true split of the population. (If you're still getting your bearings, start with what brand tracking is and why it matters.)
That's why, in this article, we turned to Luke Pearson, opens in new tab, Head of Research at Tracksuit, to help you understand:
- What is stratified sampling?
- What is quota sampling?
- Which method leads to better data for consumer brands?
- How to evaluate a tracker's sample design
- Why Tracksuit uses quota sampling with post-stratification weighting
At the end of the day, data only changes decisions if people can trust it, and trust starts with whether the sample was built to answer the question you're asking.
Sign up to Shorts
A fortnightly newsletter with exclusive brand insights, useful marketing tips, and a round-up of all the stories you should know about.
What is stratified sampling?
Stratified sampling is a probabilistic method that divides the population into groups, then randomly selects respondents within each group (note the emphasis on the word "randomly", because if you take that aspect away, you basically have a quota-based methodology).
But most brands pull data from a group of people who volunteered their time to fill out a survey (known as an opt-in panel). And that means there's a Catch-22 when it comes to stratified sampling: by definition, an opt-in panel takes randomness away.
In an opt-in panel, respondents have already chosen to be there, signed up, downloaded the app, and agreed to be surveyed, often in return for a small incentive. Rather than being a random slice of the country, they're the slice that specifically said "yes" to giving feedback.
Now, to be fair, genuine stratification does exist. It just isn’t practical for market research that runs long term, at high frequency and at high volume, which is why it’s better suited to social research.
For example, the UK's National Travel Survey ran a stratified, clustered random sample, opens in new tab of 35,156 households in 2025, achieved a 28% response rate, and still only delivered 20% more responding households than 2024 because the sample itself was enlarged. But they had something that most brands don't: a government address file, a clustered design, and enough oversampling to absorb the people who never write back.
Pew Research Center shows what that costs even when it's done beautifully. Its American Trends Panel, opens in new tab recruits members by mailing a stratified, random sample of households drawn from the US Postal Service's address file, which is about as close to real stratification as survey research gets. Once people are on the panel, response rates are excellent: 93% for the 2026 national pride study. But the cumulative response rate, once you count everyone who ignored the recruitment mail and everyone who drifted away over the years, is 3%.
Random selection from a complete frame is a beautiful thing, but it's not what any commercial tracker is capable of doing on a Tuesday morning for a quarterly report that informs Wednesday's strategy.
What is quota sampling?
Quota sampling divides the population into exactly the same groups (age, gender, region) and then fills a target count in each one until it's met. It's similar to a stratified sample, but there's no random draw, just a target and a door that closes when the target is hit.
In practice, it works like this: say a quota of 200 women aged 18 to 34 in a total sample of 2,000 is the correct allotment, because that mirrors their share of the population you’re measuring. Respondents come in through a panel, answer a few profiling questions, and get routed into whichever cell they belong to. When that cell reaches 200, the next qualifying woman in that age band gets a “quota full” message and the survey moves on without her.
Rinse and repeat across every cell until the sample is complete.
Done well, both methods fill the same cells to the same targets every month, and that consistency is what stops demographic drift from being mistaken for real movement in your brand numbers (i.e. if your sample composition is locked, a change in the data indicates a change in what people think instead of a change in who answered).
The difference is what it takes to get there. Quota sampling fills each cell with the next eligible respondent to arrive. Random selection can’t.
To stay random, you’d have to define the full pool upfront, draw more people than you need to allow for drop-off between invite and completion, and then pass over qualified respondents who show up but weren’t the ones drawn.
On a panel, that isn’t realistic. You don’t have any oversight of the panel or its composition, so qualified respondents are precious, and turning large numbers of them away because they weren’t randomly selected isn’t something any tracker can afford when it needs to hit a monthly sample.
This is why quota sampling is the default across commercial market research and not a budget alternative to something better. Both methods divide the population the same way, but they part ways at the selection step, and it's the selection step that an opt-in panel struggles to perform.
Dividing the population
- Stratified sampling: Split into groups (age, gender, region) relevant to the study
- Quota sampling: Split into the same groups, same way
Selecting respondents
- Stratified sampling: Random draw within each group
- Quota sampling: Fill a target count per group until it's met
What it needs to know about each respondent
- Stratified sampling: Profile details (age, gender, location) to place them in a group
- Quota sampling: The same profile details, to route them into a cell
What it requires of the frame
- Stratified sampling: A complete list you can randomly select from, then chase down
- Quota sampling: A pool of willing respondents to screen and quota
Achievable from an opt-in panel
- Stratified sampling: No, opt-in breaks the randomization
- Quota sampling: Yes, it's what panels are built for
Post-stratification weighting
At first glance, it might sound like removing the randomness removes some reliability in the final results, but that's where post-stratification weighting comes in. It's the correction applied after collection: you compare the sample you invited with the sample you achieved, then adjust each respondent's contribution so the total matches the population.
Our philosophy is to collect the best-controlled sample you can first, then weight only to close that invited-versus-achieved gap. The ideal result is no weighting at all. A good result is factors sitting just under or just over 1x, so each person counts as roughly one person.
If you over-weight one respondent three or four times, one person’s opinion carries a broader impact than it should, like the one bad experience they had with your returns process, the competitor ad they happened to see that morning, or the fact your product was out of stock the last time they went looking.
But now, all of those opinions speak for the larger demographic.
A weight of 1.5x is tolerable, but a weight of 4x is a sample problem pretending (quite confidently) to be a statistic that you'll be tempted to act on.
Which method leads to better data for consumer brands?
Ok, so one method has a rigorous reputation and the other has a practical one. It's fair to ask how much you're actually giving up.
Turns out, it’s much less than you'd think.
A 2025 US Census Bureau working paper, opens in new tab found that, holding costs steady, optimal stratification improved average precision by between 1.47% and 17.25%, depending on how much weight the design gives to subgroup estimates. That's a real gain, from a government statistical agency rather than a vendor.
It's clear that stratification does something. But the famous advantage of the method, the thing the word is borrowed to imply, is a modest arithmetic gain at the allocation step. In practice, precision comes from two less glamorous things: how many people you talk to, and how carefully the panel is managed.
That Pew wave we mentioned carried a margin of sampling error of ±1.6 points across 5,153 respondents. Which means when one methodology page says “stratified sample” and another says “quota sampling with post-stratification weighting,” the translation for your buying committee is this: both are dividing the population the same way, both are filling groups from a panel, and neither label tells you whether the sample’s composition actually represents your category.
So what does? Two things: how the quota cells were built, and how far the weights had to stretch.
How to evaluate a tracker's sample design
1. Quota architecture
When we asked Luke how often he’s seen methodology meaningfully change a result, he told us it’s rare, because controlling for demographics is such a basic standard of the work. What he gave us instead was even more useful: the mechanism.
If you set age quotas independently of gender, then every individual quota can be satisfied while the sample quietly becomes almost entirely older men plus young women. Young men and older women simply never show up, but no fire alarms go off because the age column and the gender column both hit their targets. Interlocking quotas (age crossed with gender, so “young women” is its own quota cell) close that gap.
This is a design choice made before a single respondent is screened, and it's the kind of choice that decides whether your category read is a measurement or a coincidence.
Left with no demographic control at all, online samples fail in predictable directions, though the specifics shift depending on the market and the panel:
- Young males are chronically under-responsive in most Western markets (you have to pay them more and ask them twice)
- Unweighted samples skew 35 to 55, tend to skew female, and the very young/very old get missed entirely
- Income and education skew upward through device access, partly offset by panel incentive design (cash for lower-income panelists, status points and airline miles for higher earners)
Put plainly, the tracker that interlocks its quotas and manages these skews is doing more for the accuracy of your category read than the one whose deck says “stratified.” (It’s also what makes measuring brand growth over time trustworthy at all.)
Four questions to ask any tracker about its sample
Which gives you something better to walk into a vendor call with than a methodology page. Luke’s evaluation list for a brand tracker is short enough to fit on a sticky note:
- Screening and qualification: who gets screened into the study and who gets excluded? For a category read, exclusions should be little more than age and geography.
- Quotas set: which variables, and are they interlocked? Age crossed with gender, not two independent columns.
- Weights applied: on which variables, and how large do the factors run? Close to 1x is the answer you want.
- Mirror check: do the sample and weighting variables match each other? Correcting what you never measured is theater.
One thing worth holding onto in that call: every metric in a category tracker is read against the same measures for the competitor set, so the screening and quota questions apply across the whole category (not just your brand). That shared architecture is what makes brand growth benchmarks comparable in the first place.
Why Tracksuit uses quota sampling with post-stratification weighting
Tracksuit sets quotas on age, gender and region against current population estimates instead of census figures, which can lag by years, and adds ethnicity in the US. Weighting then corrects the gap between the sample we invited and the sample we achieved, on those same variables. Representative by design, corrected only where collection fell short (the full detail sits in how we build a nationally representative sample in the US and the UK).
The reason that combination suits us comes down to what’s repeatable twelve times a year. That applies to how granular the quotas get, too: the number of cells is set at a level that’s practical to fill and repeatable every month, rather than cut as finely as possible. Sample design decides who answers, but cadence decides when, and it’s the “when” that carries its own skew.
There are two reasons for that:
- Capacity: pushing thousands of completes through a panel in one window strains supply in a way that spreading them across twelve months doesn't.
- Representativeness: whatever month you pick, you've sampled the season as much as the population. Year-round collection represents the whole year.
And this is observable in all the data we've seen. Our category tracker returns consecutive monthly waves (each repeat of the survey) with continuous history back to October 2024. And the cadence is what makes real movement visible:
Revolut's 63% to 78% awareness gain among UK adults 55 and over came from two separate campaign bursts and not a single steady climb:
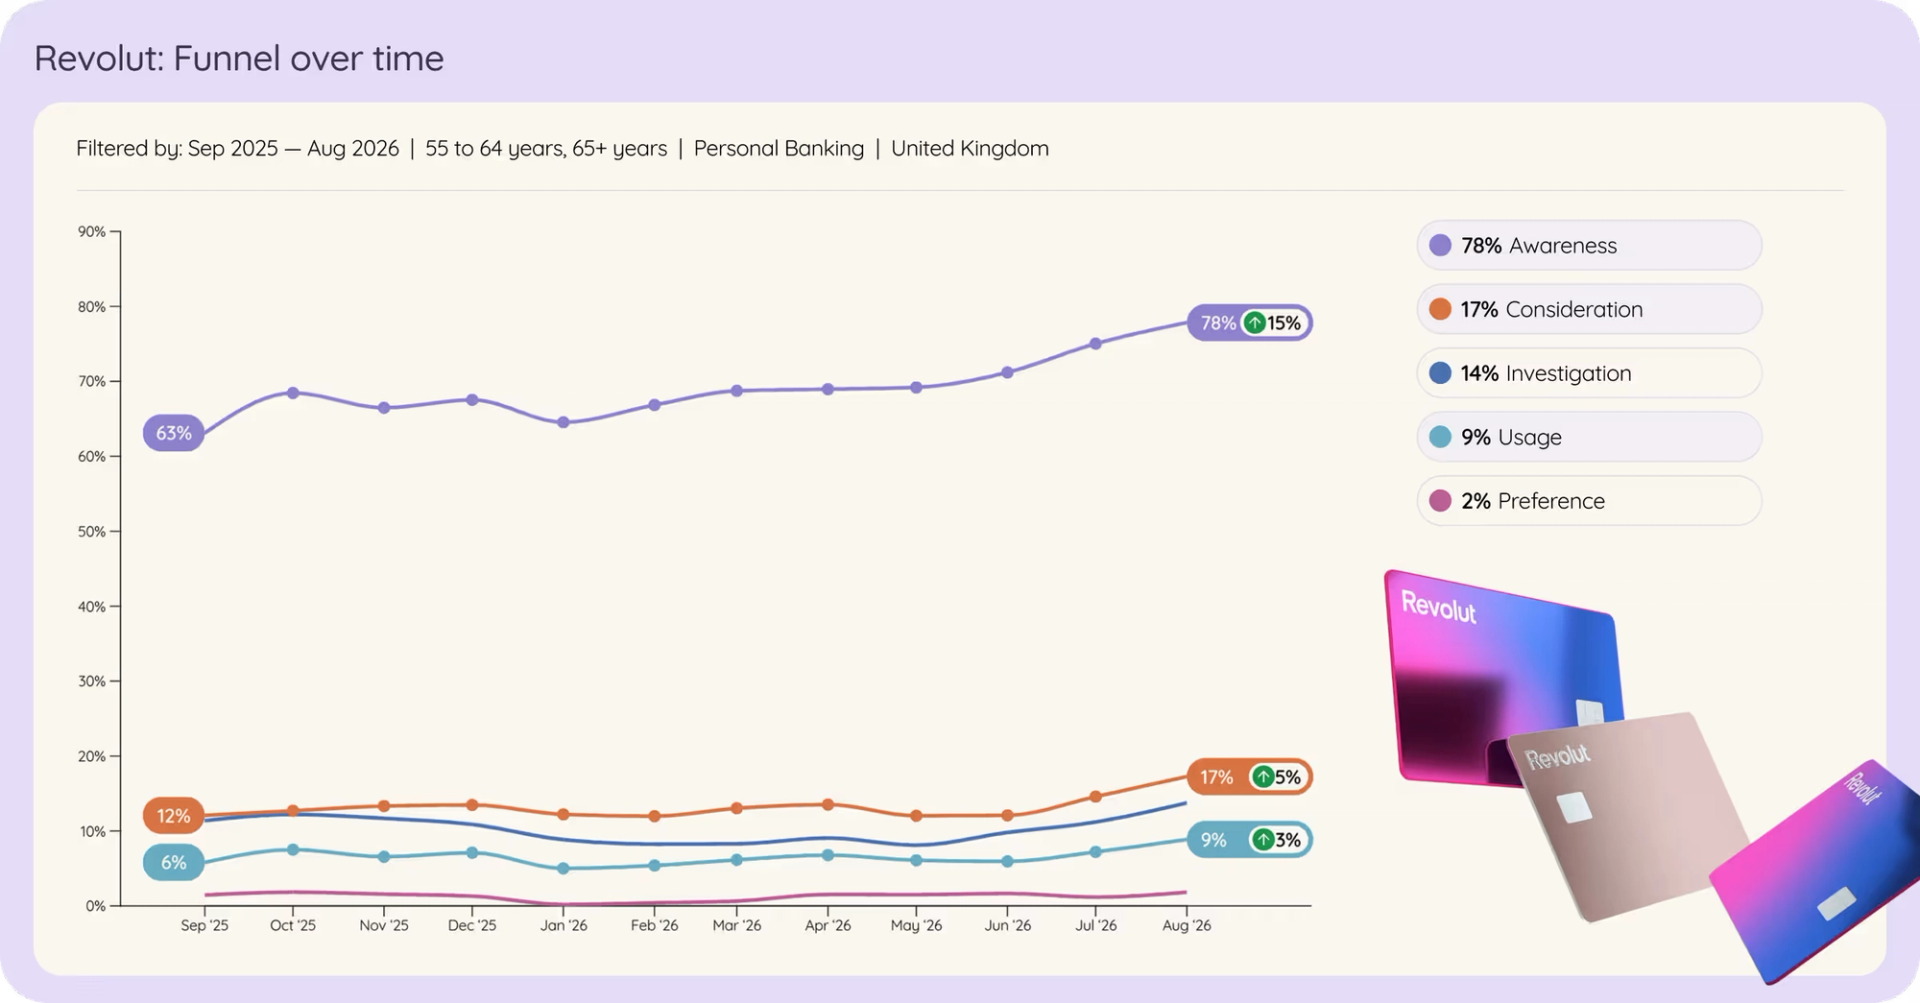
An annual read would draw a straight line between 63% and 78%, but the monthly view shows the two steps that actually got it there (which is the difference between knowing your awareness moved and knowing what moved it).
Depop ran three separate campaigns inside a single year:
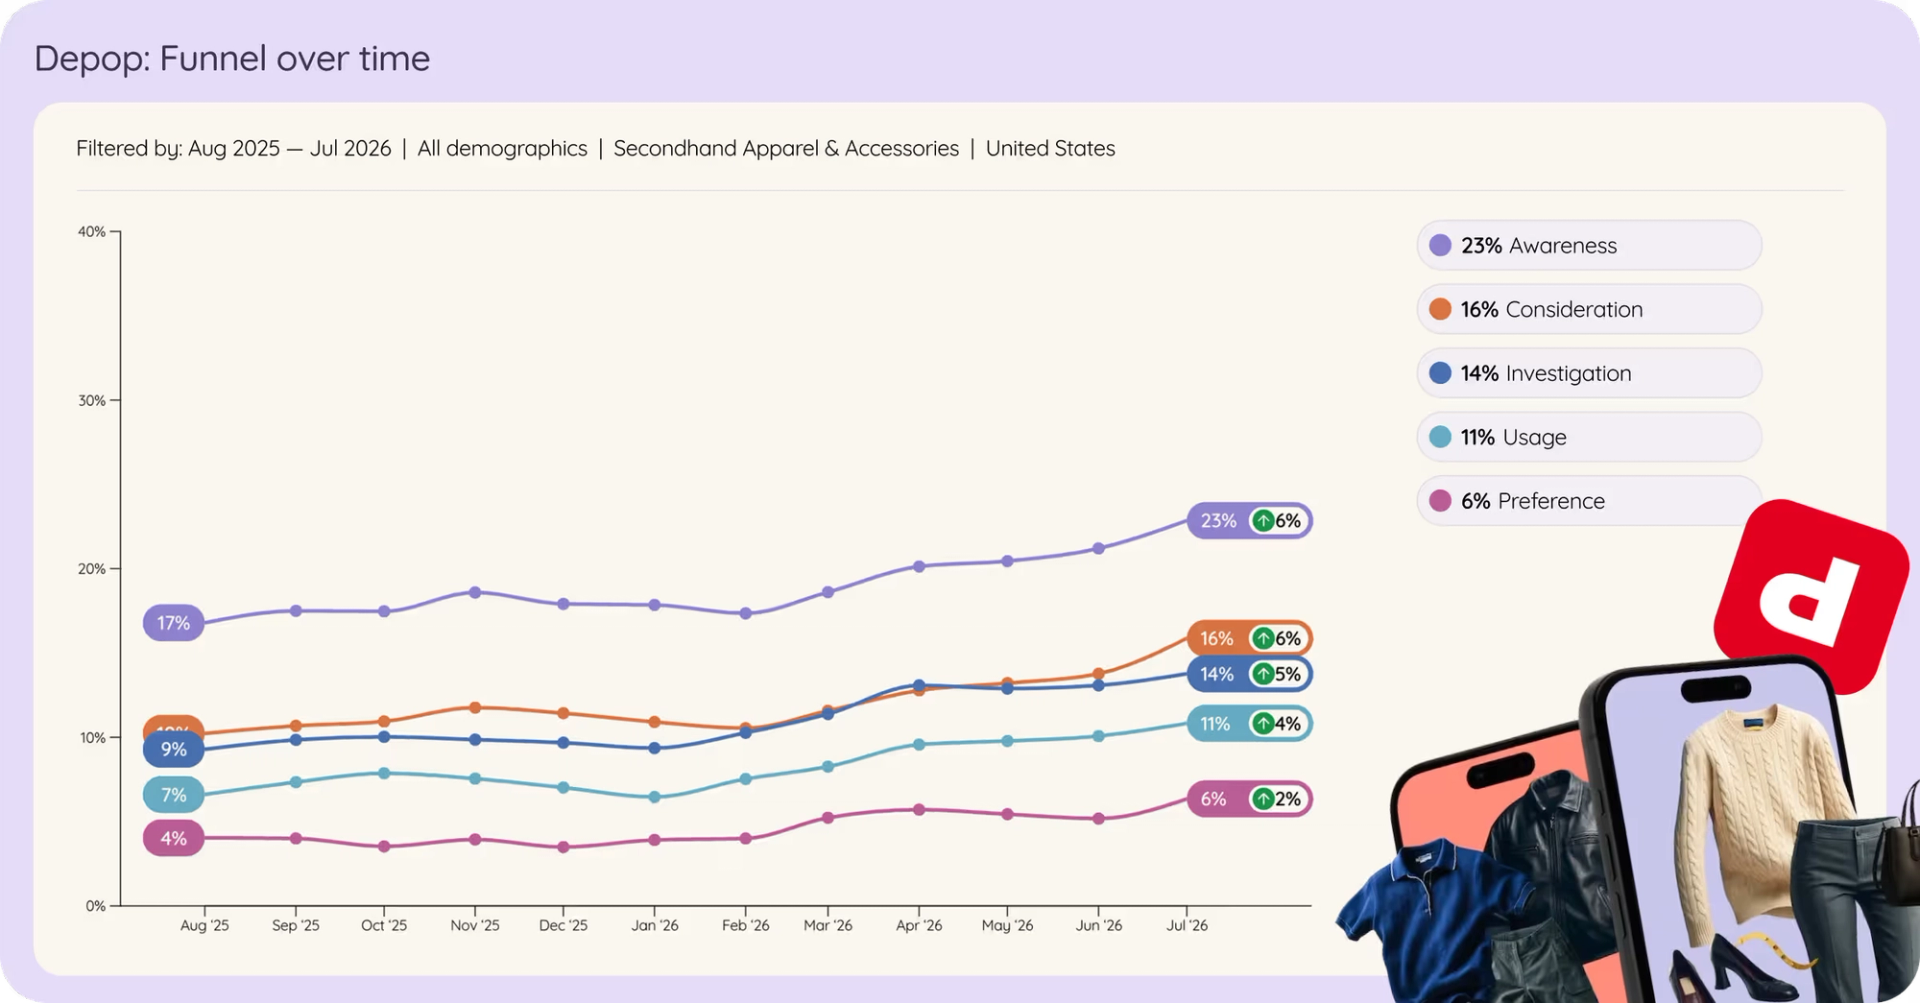
Three campaigns inside twelve months average out to one number in an annual study, and averaging is how you lose the ability to tell which of the three was worth repeating.
Sezzle's marketing spend rose unevenly quarter to quarter, more than doubling year-on-year in one quarter alone (hence the spike at the end):
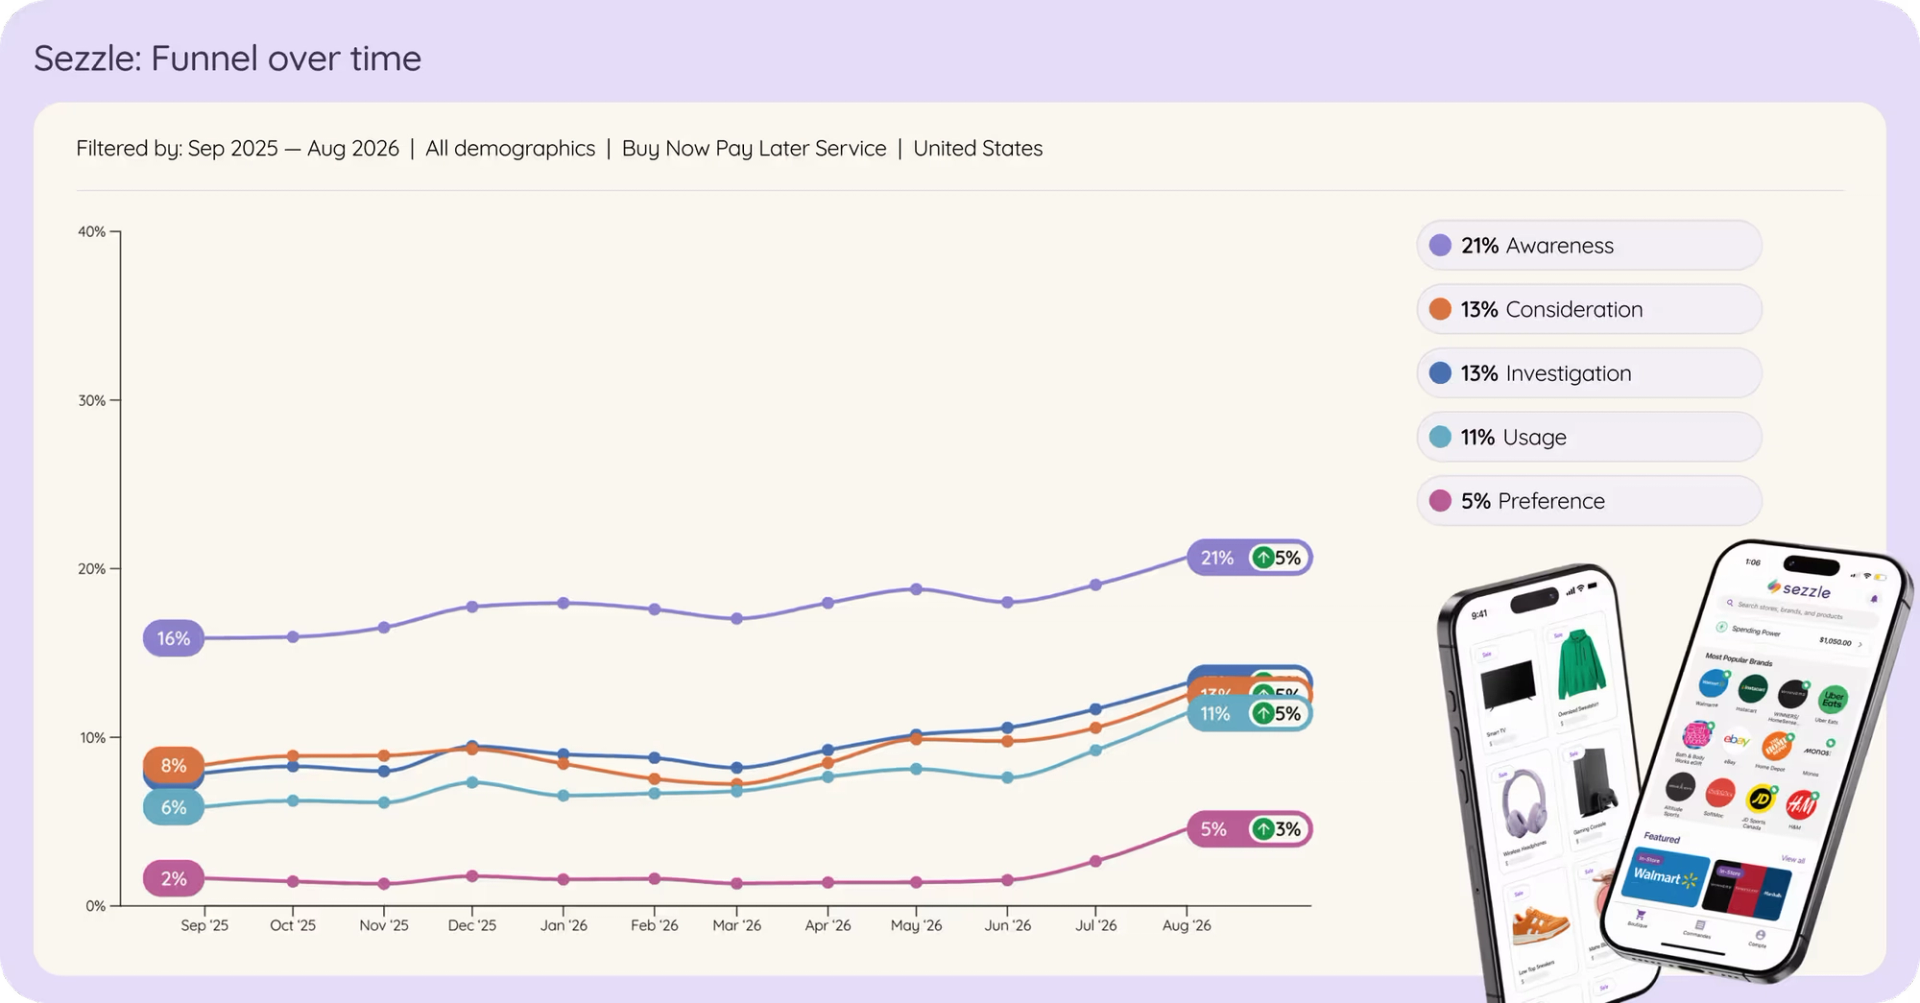
Spend didn't arrive evenly, so the funnel didn't move evenly either, and you can only line the two up if both are measured on the same monthly clock.
Under any single annual measurement, all three flatten into one number, whether that measurement used quota sampling or the genuine stratified article. The sampling method wouldn't hide the story. The calendar would.
It's the single biggest practical difference between ad hoc and always-on brand tracking.
Which brings it full circle to Luke's answer. Quota sampling with post-stratification weighting is the less glamorous sentence in the methodology doc. But it's also the one that tells you what questions to ask, where a representative read actually gets made, and how far to trust a weight.
Frequently asked questions
What is stratified sampling in simple terms?
Stratified sampling is a probabilistic method where you divide a population into groups (say, by age and gender), then randomly select respondents from within each group. With this methodology, randomization is the whole point. It's what makes the sample provably representative rather than just designed to look that way.
Is stratified sampling the same as quota sampling?
No. Both methods split a population into the same kinds of groups, but they part ways at selection. Stratified sampling draws respondents at random within each group; quota sampling fills a target headcount in each group without a random draw. They divide the pie identically and cut it differently.
Can an online panel deliver a truly stratified sample?
Not an opt-in one, no. A panel like that is made of people who already chose to join, which breaks the random selection stratified sampling requires before you've asked a single question. Probability-recruited panels like Pew's get closer, by mailing a stratified random sample of households, but the cumulative response rate on that approach runs around 3%. It's why Tracksuit describes its own method as quota sampling with post-stratification weighting (i.e. correcting the sample's demographic mix after the fact) rather than claiming stratified sampling.
What is post-stratification weighting?
It's the correction applied after the survey closes, adjusting for the gap between who you invited and who actually responded. If your quota called for 200 women aged 18 to 34 in a sample of 2,000 and you only got 160, weighting nudges their responses up slightly to match the target. Ideally there's no weighting at all; done well, individual factors sit just under or just over 1x. Push one respondent's weight to 3 or 4x and a single person's personality starts speaking for a whole demographic.
Do strata need to be the same size?
No. Proportionate allocation mirrors the group's real-world size in the population; disproportionate (or optimal) allocation deliberately oversamples a smaller group so its read doesn't wobble. Either is legitimate. What matters is that the choice is deliberate, not an accident of who happened to respond.
What are interlocking quotas, and why do they matter?
Interlocking quotas set age and gender targets together (young women, older women, young men, older men) rather than separately. Without interlocking, Luke notes, you can hit every individual quota and still end up with mostly older men and young women, missing young men and older women entirely. It's a design flaw, not a sample-size problem.
How big should weight factors be before I worry?
Keep an eye on anything above roughly 2-3x for really niche groups. Tracksuit's own standard targets factors close to 1x, correcting real gaps between invited and achieved sample rather than manufacturing a segment out of thin air. A heavily weighted handful of respondents can end up speaking for an entire demographic; that's the failure mode to watch for.
Does stratified sampling guarantee a representative sample?
It gets you closer, but the US Census Bureau's 2025 research found that optimizing how a stratified sample is allocated only improves precision by 1.47% to 17.25%, at the same cost. Quota architecture and weighting do more of the practical work. Ask any vendor what's screened, what's quota'd and what's weighted before taking the label at face value.