The Inside Track
A weekly look at what Tracksuit's marketing science team is seeing in the data. Every story is built from Tracksuit data, the always-on brand tracker. Request a demo to see it for your brand.
68 stories
 Amazon delivers growth across the full funnel in Australia
 Yo-Chi serves up gains in three funnel stages in Australia
 DraftKings stacks up gains at every funnel stage in the US
 Nationwide increases Awareness through to Preference in the UK
 PG Tips brews up gains among 35+ year olds in the UK
 BIG4 Holiday Parks grows every funnel stage in Australia
 Goose Island grows three funnel stages among 21-34s in the US
 Ecover grows Awareness and Consideration in the UK
 Alo grows Awareness, Investigation and Preference in the US
 Head & Shoulders grows Preference, the hardest metric, in the UK
 Allens climbs across awareness, consideration and usage in AU
 Dutch Bros Coffee grows across every funnel stage in the US
 Fancy Feast rises across three funnel stages in Australia
 Intrepid Travel grows from awareness to usage in the UK
 Fortnite gains on three funnel stages in the US
 Bowel Cancer Australia climbs across every funnel stage
 Monzo strengthens across every funnel stage among UK males
 Jacob's Creek lifts three funnel stages among UK females
 Corona builds three funnel stages among UK males
 Walkers pulls ahead on Preference in the UK Crisps category
 Bluey's brand funnel has climbed in Australia
 Sezzle surges across every stage of the funnel in the US
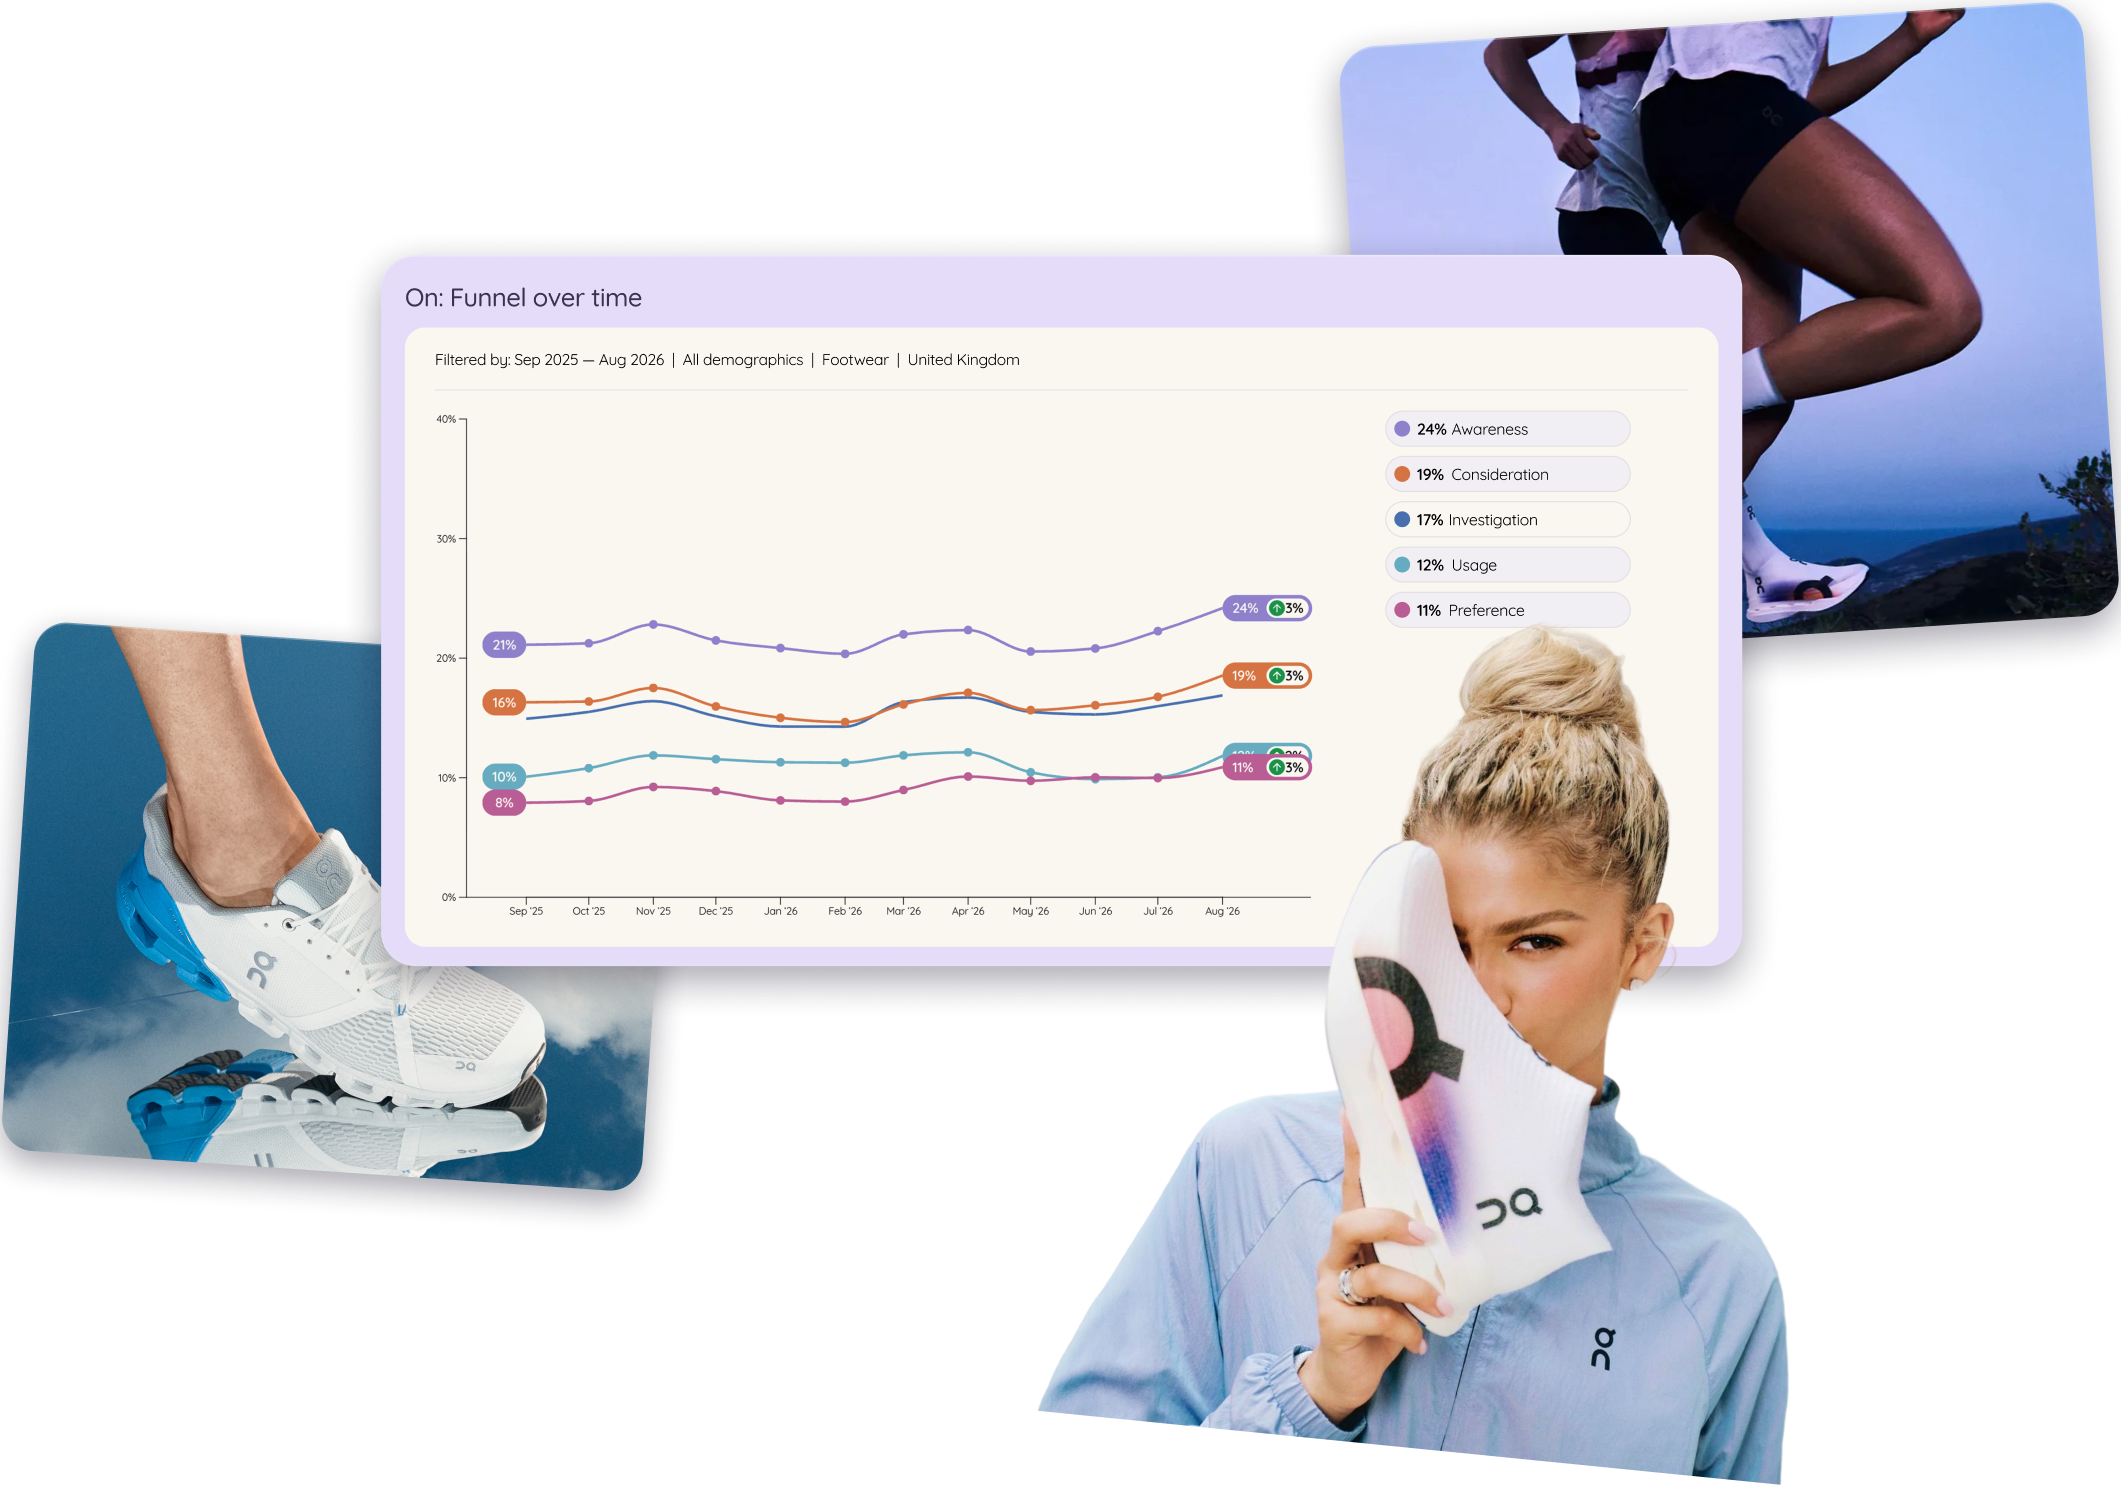
 On builds momentum across its UK Footwear funnel
 Klarna strengthens every funnel stage in the UK
Frequently asked questions
What is The Inside Track?
The Inside Track is a weekly series from Tracksuit's marketing science team. Each week it looks at brands whose brand health is growing, with one story per brand covering how they moved through the funnel and what brand-building sits behind it.
Where does the data in The Inside Track come from?
It comes from Tracksuit's brand health tracker. Each story compares a 12-month period, for example September 2025 to August 2026, and looks at how a brand's metrics moved within its category and country.
How often is The Inside Track published?
New stories are published every week.
How do I read the charts?
Each chart shows a brand's funnel over time, with a line for each stage the brand has data for, such as awareness, consideration, investigation, usage and preference. The labels show where each line started and ended, and the change in percentage points (pp). Lines use a 3-month rolling average, and charts are filtered by category, country and sometimes an audience such as age or gender.
Which brands and countries does The Inside Track cover?
Brands in the US, UK, Australia and New Zealand, across industries from food and drink to financial services, health and beauty, and travel. Each story picks a brand whose metrics have grown significantly over the period, and you can filter the list by industry or region.
How can I see my own brand's funnel?
Tracksuit's brand tracker shows how awareness, consideration and preference move for your brand over time, and how that compares with competitors and the category. Book a demo to see it.
Want a funnel like this for your brand?
Get a tailored walkthrough of Tracksuit, the always-on brand tracker behind the data in The Inside Track. See how awareness, consideration and preference move for your brand, and how you compare with competitors and the category.
Book a demo