
Every November, retailers spend a fortune and consumers spend a weekend trying to work out the same thing: where are the real deals this year? Black Friday and Cyber Monday (we’ll call it “BFCM” for short) has gone from an American post-Thanksgiving ritual to the biggest shopping moment on the global calendar. It now stretches across two weeks, every major retailer is flooding inboxes with early-access offers, and Temu, Shein and AliExpress have turned up with prices that make everyone else’s biggest discounts look like a rounding error.
So before this year’s sale landed, we did what we do best: we crunched the numbers. In October 2026, Tracksuit surveyed 10,442 adults across seven countries, the UK, the US, Canada, Australia, France, Germany and Japan. Of those, just over half (54%, 5,666) had either bought in last year’s BFCM sales or said they were open to doing so. Those are the shoppers whose answers you’ll read below. In each market we tracked 15 major retailers: the global marketplaces (Amazon, Temu, Shein and AliExpress, plus eBay in every market except Japan) alongside the big local names across electronics, general merchandise, department stores, grocery, fashion and beauty. We asked shoppers who they’d heard of, who they’d consider, who they bought from last year, who they’d prefer to buy from this BFCM, and what they believed about each brand.
Black Friday has a reputation as a free-for-all of bigger discounts, earlier deals and increasingly louder attempts to get shoppers to hit ‘buy now’. It’s an easy conclusion to reach when discounts dominate the conversation. What shoppers told us goes deeper. The retailers they prefer are strong on two things at once. They have mental availability, meaning shoppers know them and would consider them, and physical availability, meaning shoppers can find and acquire items easily. So while discount culture may feel like a race to the bottom, people are actually racing to the strongest brands.
We’ll kick this blog off with who is winning on purchase and preference, then how mental and physical availability line up behind the brands that win, and the wider brand picture behind it. The retailers that win are the ones that turn “I’d consider it” into “I bought it”, and then into “I’ll be back next year”.
Remember what we’re reading here: this is shoppers’ state of mind going into Black Friday 2026, not what happens during it. We’ll follow up in January with three months of data and the full story. Here’s what we found so far.
Two-thirds of the UK is in. Almost two-thirds of Japan isn’t
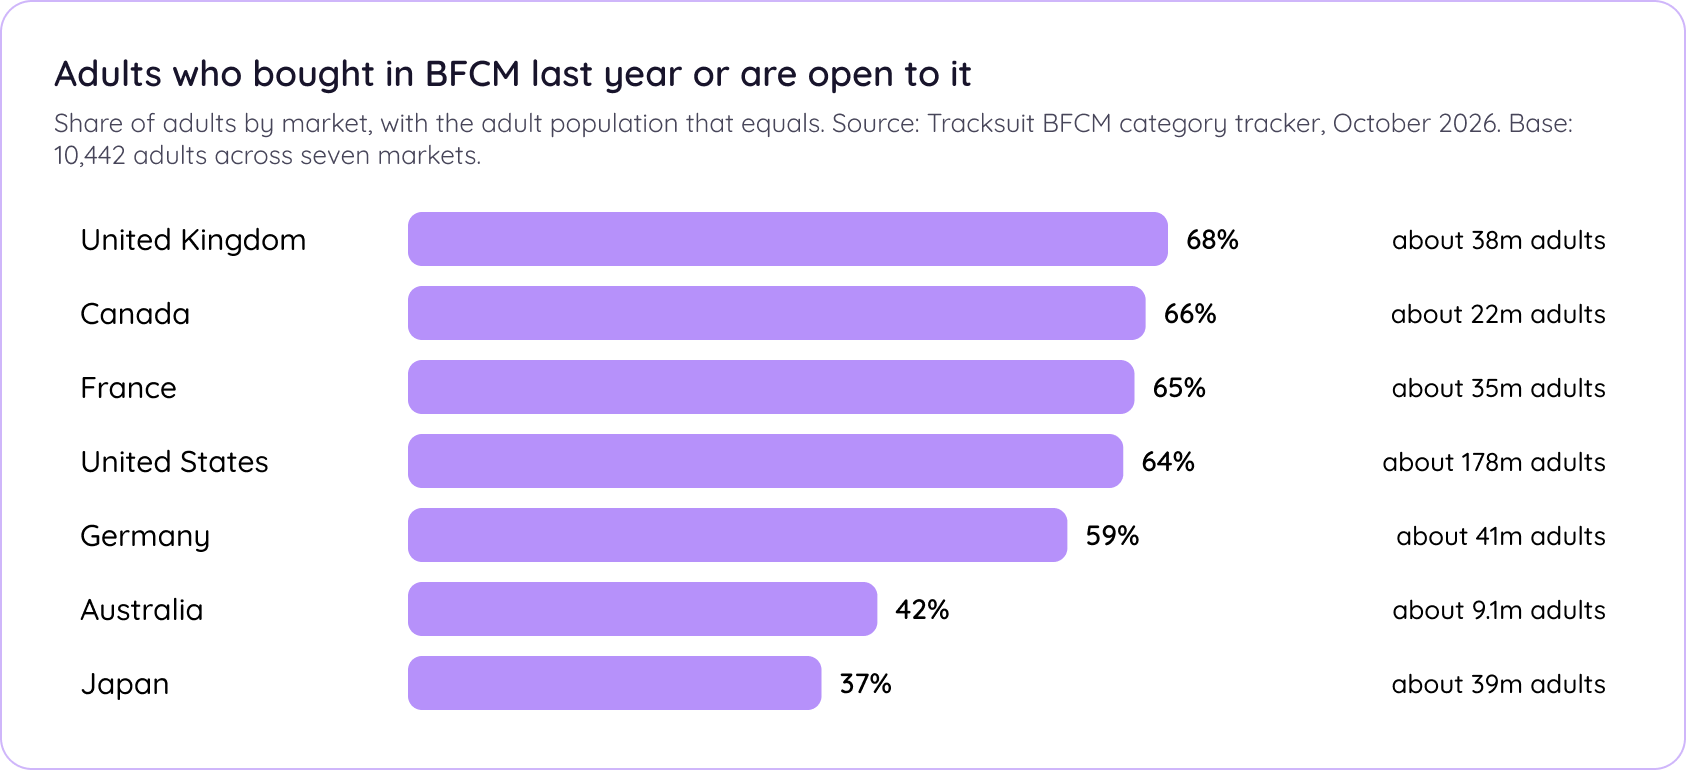
While BFCM may be the largest recognized global sale event, the way consumers engage with it varies a lot by region. In the UK, 68% of respondents had bought in a BFCM sale or are open to it. Canada (66%), France (65%), the US (64%) and Germany (59%) are in the same band. Then there’s a cliff. Australia sits at 42% and Japan at 37%, so in those two countries more than half of adults are neither buying nor planning to.
Percentages hide scale, though. When we translate that into actual shoppers based, Japan’s 37% equates to roughly 39 million people, slightly more than the UK’s 68% does (about 38 million). The US figure equates to roughly 178 million. If you sell in Japan, the lesson isn’t “nobody cares”, it’s “a third of a very large country cares a lot”.
The chart shows the share of adults in each market who bought in a BFCM sale in the past year or are open to doing so, alongside the number of adults that represents.
Sign up for Shorts
For fortnightly brand insights, stories and goodness that’ll help you win (we promise).
Amazon is winning the race. Second place is open in most markets
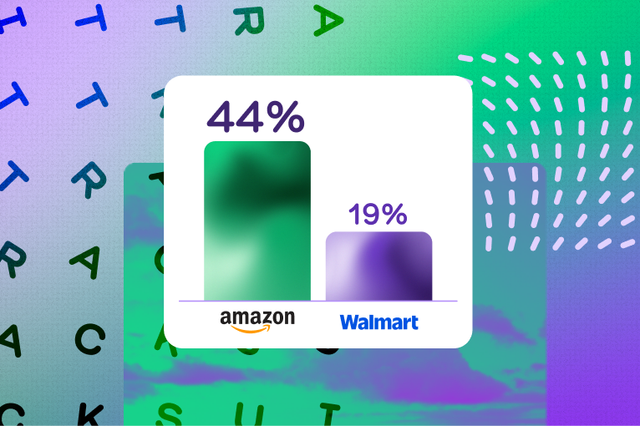
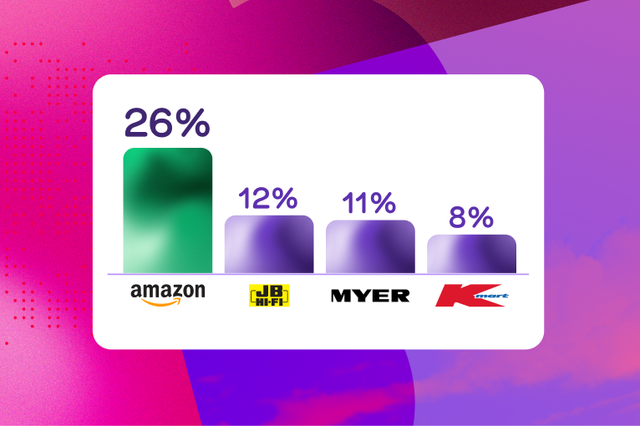
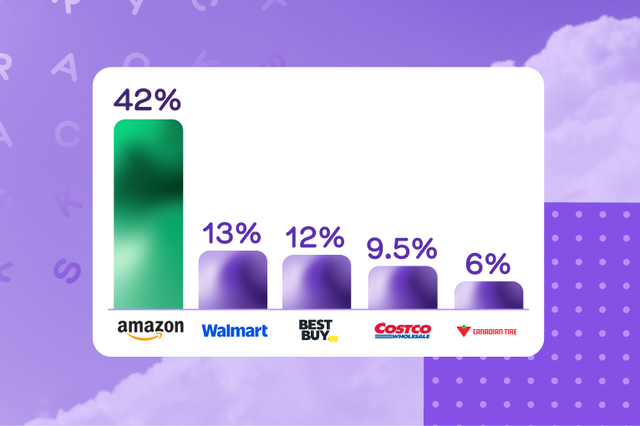
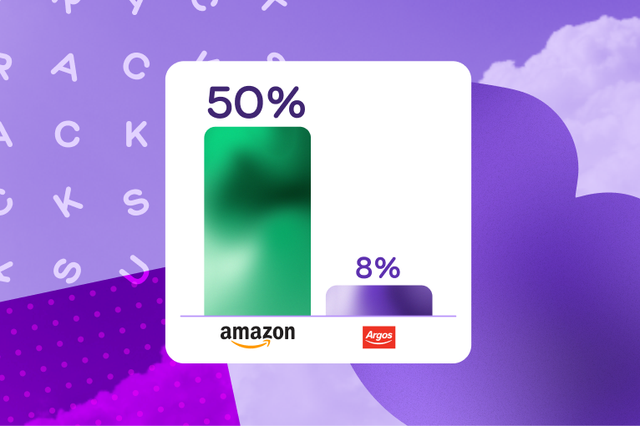
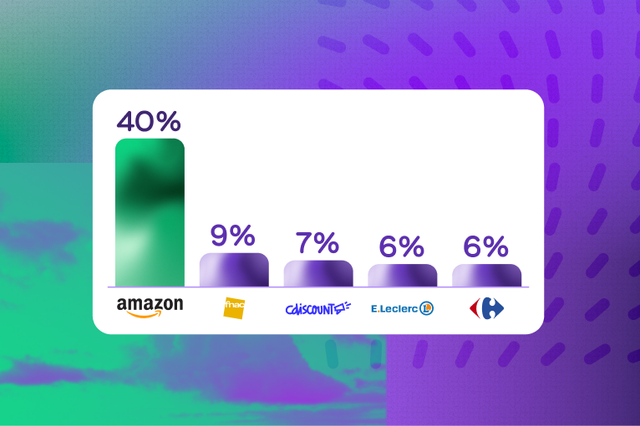
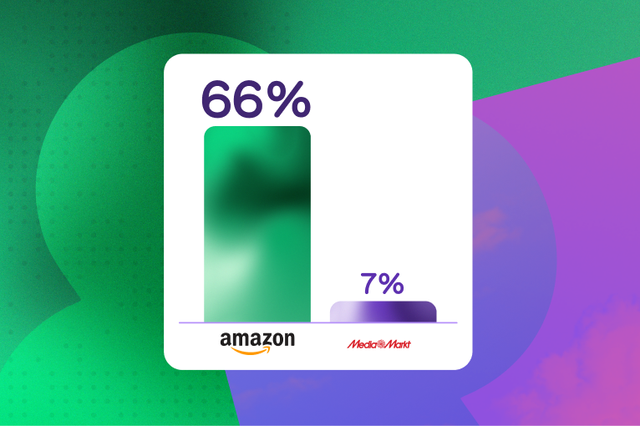
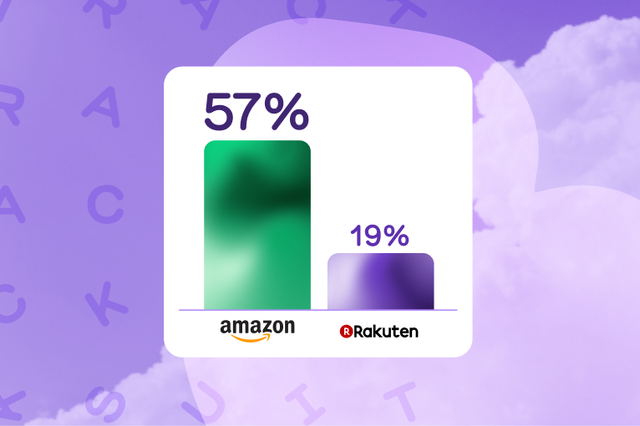
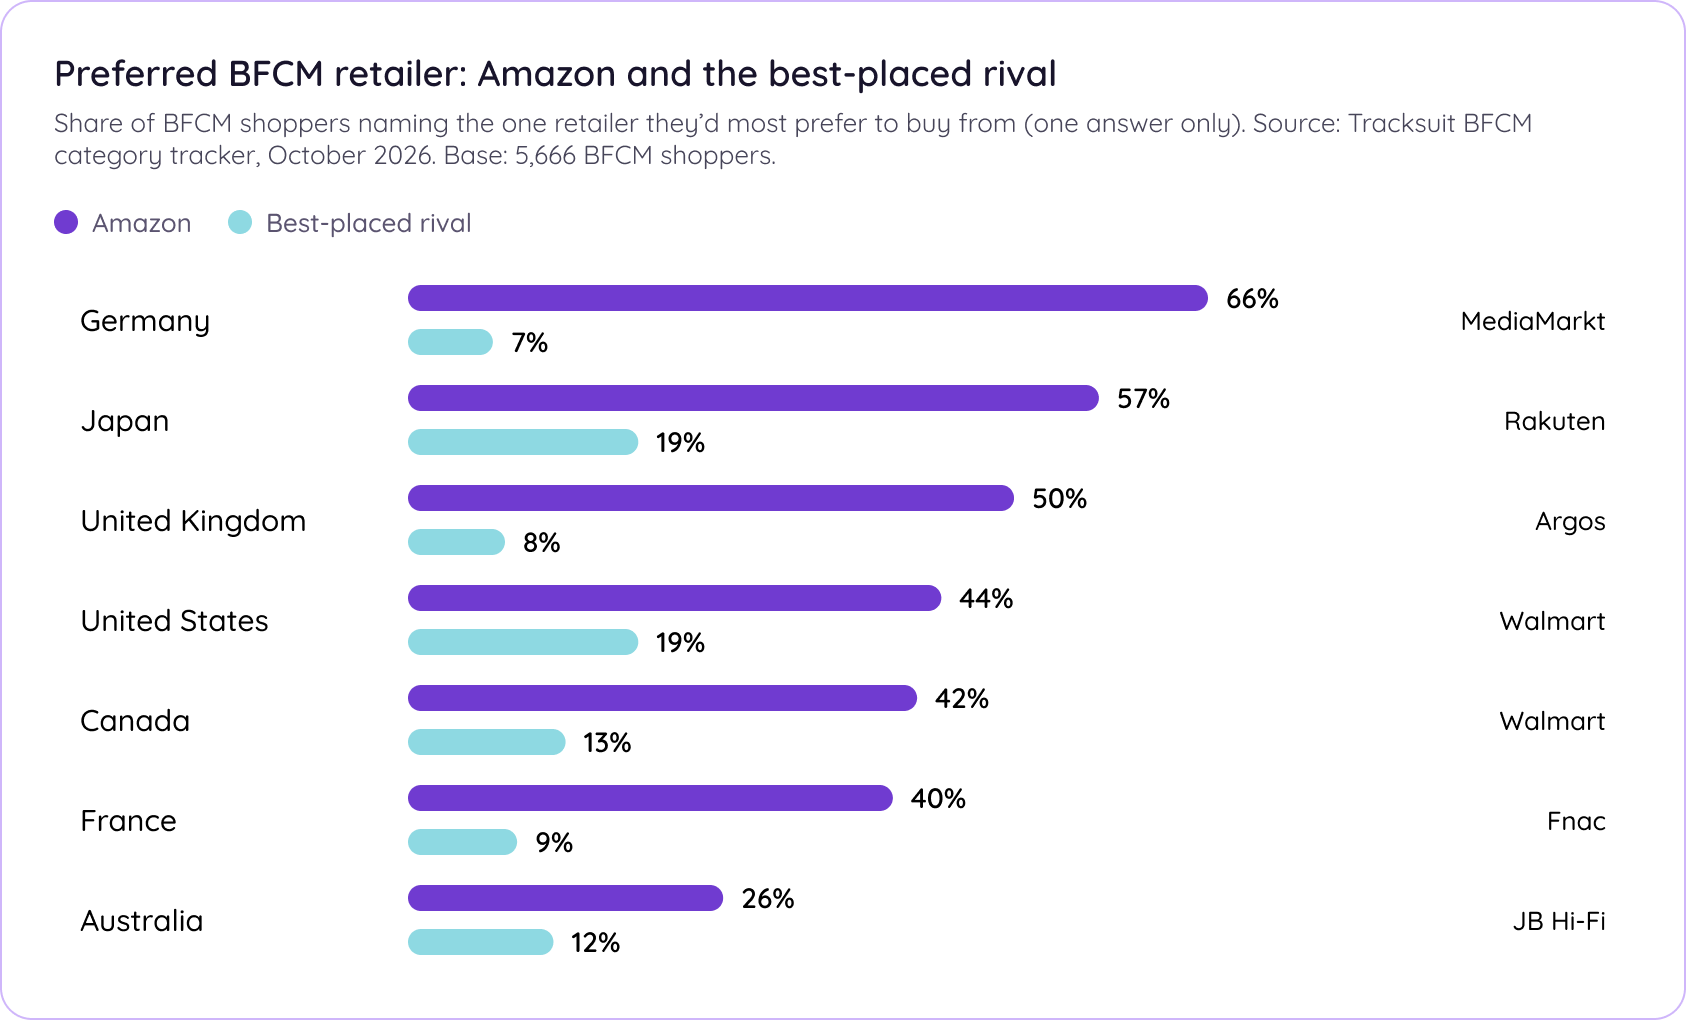
Ask people which retailer they’d prefer to buy from during BFCM, one answer only, and the category collapses to a single name. Amazon is the preferred BFCM retailer for 66% of German shoppers, 57% in Japan, 50% in the UK, 44% in the US, 42% in Canada, 40% in France and 26% in Australia. The next-best brand is anywhere from 14 to 59 points behind, depending on the market. In the UK, France and Germany, Amazon is the only brand that reaches 10%.
The runners-up tell you something about each market. Walmart (preferred by 19%) in the US and Rakuten (19%) in Japan are the only second-placed brands near 20%. Everywhere else it’s a local hero in single digits: Argos in the UK, Fnac in France, MediaMarkt in Germany, JB Hi-Fi in Australia.
The chart below puts Amazon’s preference share next to that of the best-placed rival in each market.
Most BFCM shoppers buy from one or two major retailers, and Amazon’s funnel is the tightest
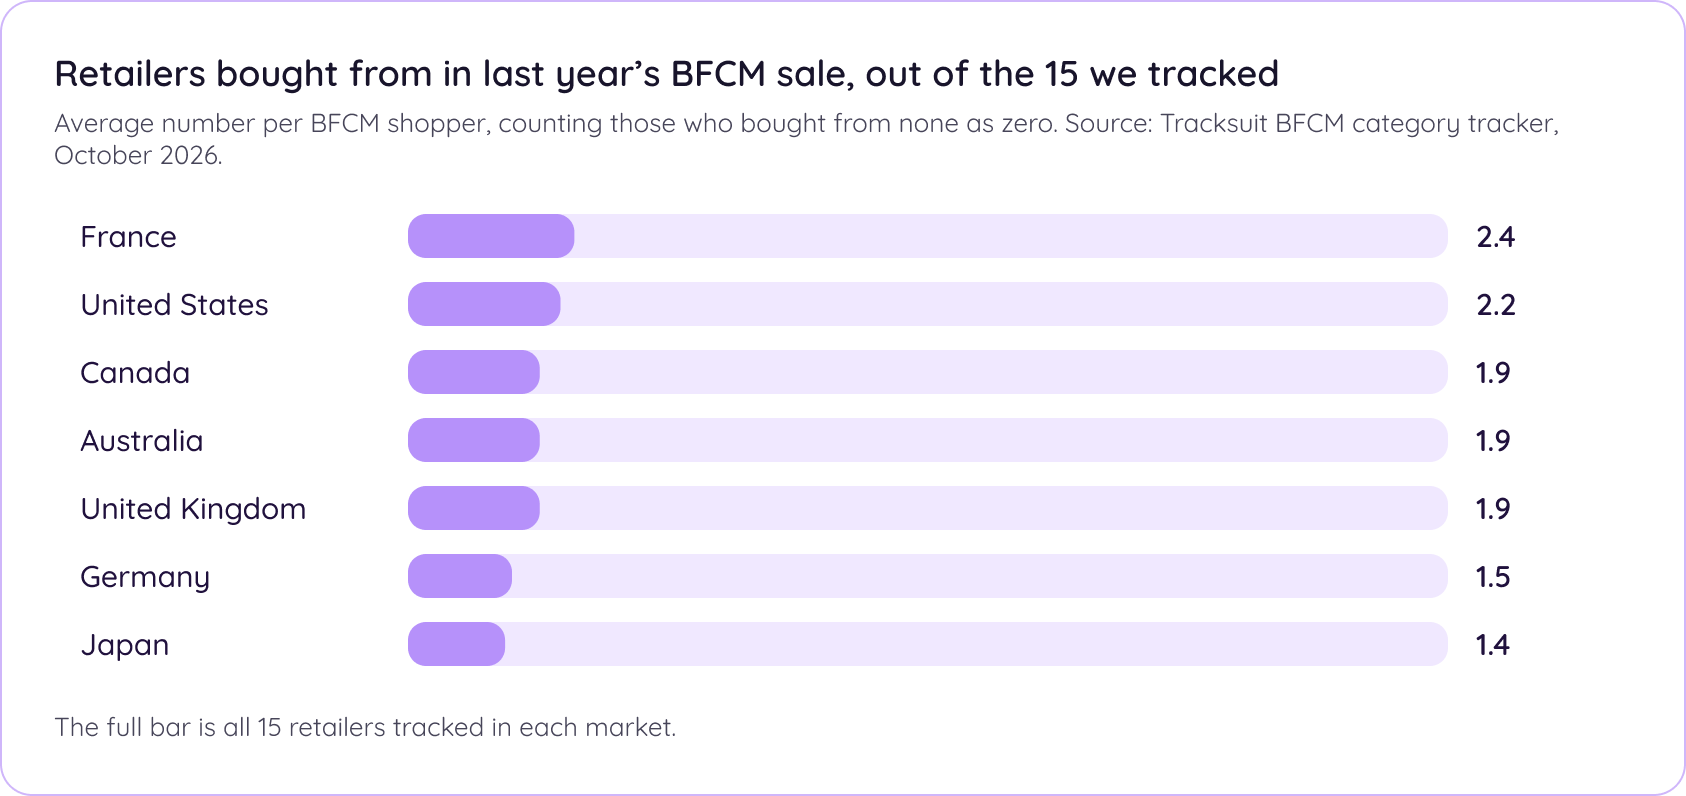
Preference tells you who people want. Purchase tells you who gets the money, and it’s the stage many BFCM stories skip. We asked each shopper which of the major retailers we tracked they had bought from last Black Friday or Cyber Monday, and they could pick as many as they liked. Add those purchase rates up across the 15 major retailers we surveyed in each market and you get the average number of those 15 that a BFCM shopper bought from. Shoppers who bought from none of them count as zero.
The answer is fewer than you’d think. French shoppers bought from 2.4 of the 15 major retailers we surveyed, US shoppers 2.2, Canadians, Australians and Brits about 1.9, Germans 1.5 and Japanese shoppers 1.4. This counts only the 15 major retailers we tracked, not every shop a person bought from, so real baskets are a little wider everywhere. The ranking is the point. Amazon accounts for 46% of all the retailer purchases Japanese shoppers reported across the 15, and 44% in Germany, against 29% in the UK, 29% in Canada, 28% in the US, 23% in France and 17% in Australia.
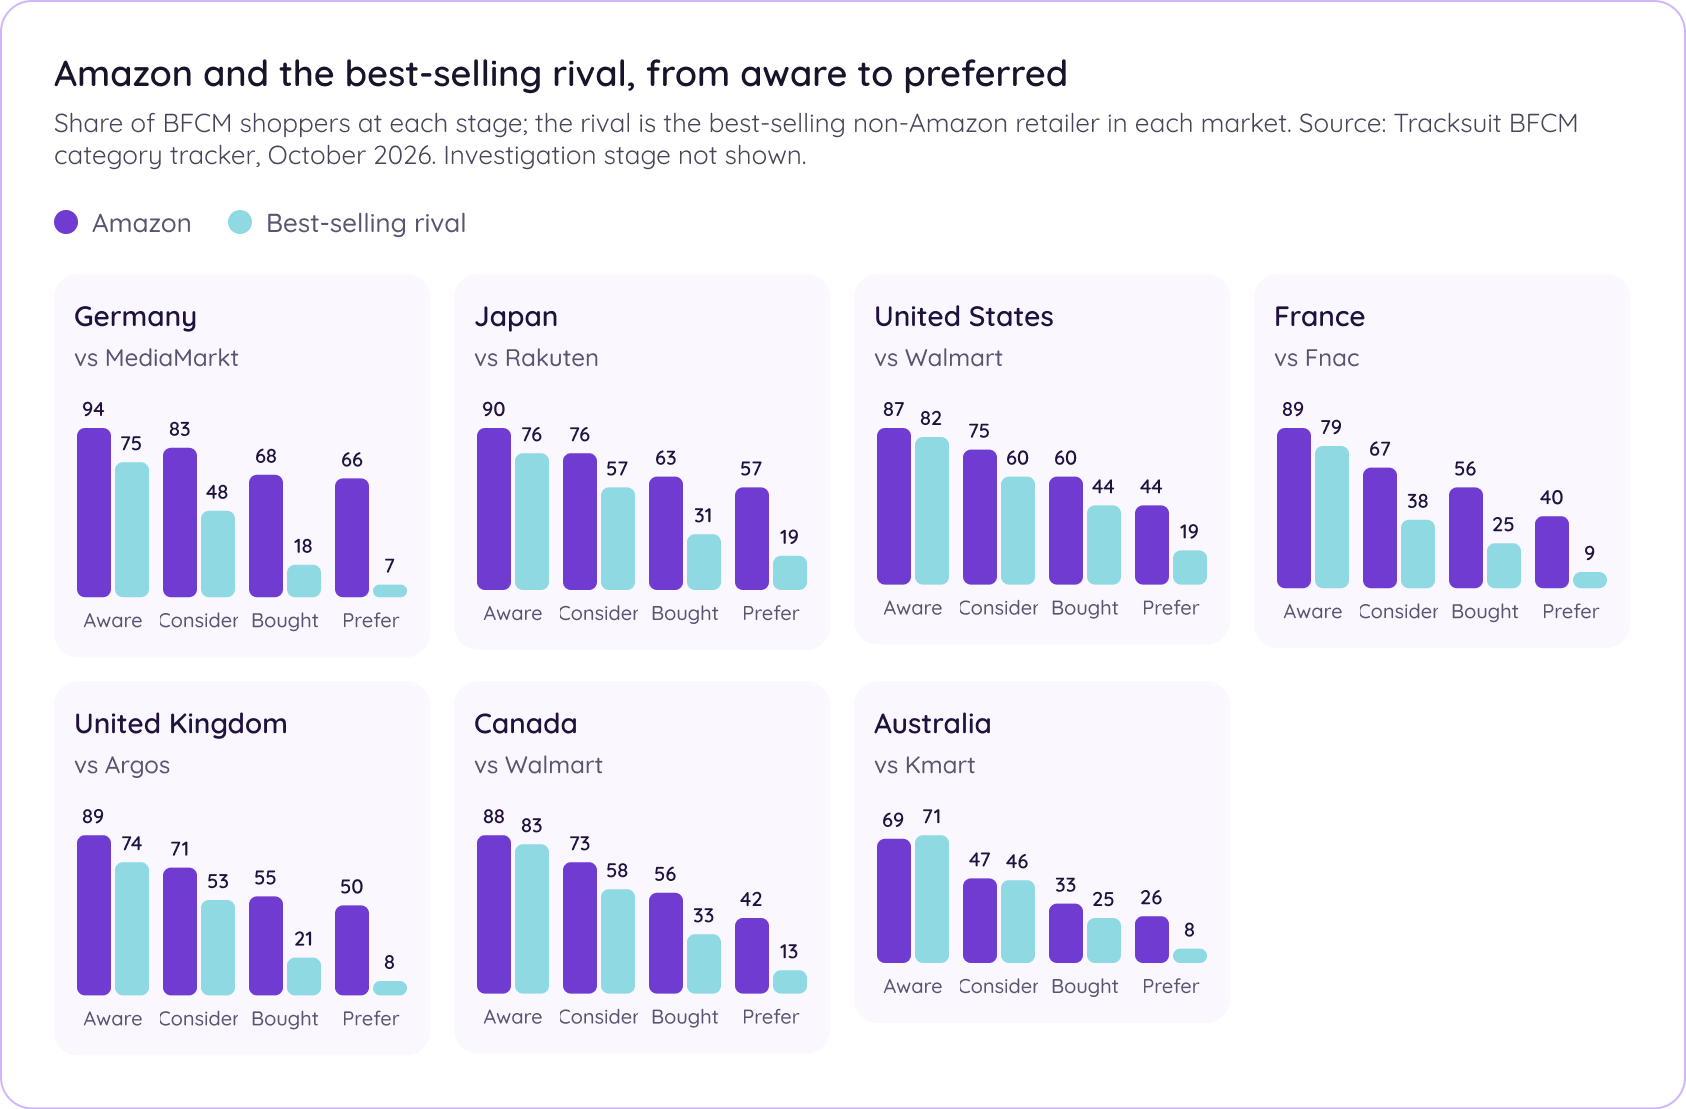
Awareness and consideration are how we read mental availability: whether shoppers know a retailer, and whether they’d think about buying from it. Both are important for turning shoppers into customers. Amazon is particularly good at turning purchases into preference. In Germany Amazon is bought by 68% of shoppers and is preferred by 66%; MediaMarkt, the best-selling local brand, is bought by 18% and preferred by 7%. In markets like France, the US and Canada, shoppers spread their purchases across more retailers, giving competitors a bigger share of the action.
Walmart is bought by 44% of American shoppers during BFCM, and four French retailers (Fnac, Cdiscount, E.Leclerc and Carrefour) are each bought by 19 to 25%. In six of the seven markets, Amazon is known by 87 to 94% of shoppers, considered by 67 to 83% and bought by 55 to 68%. What sets Amazon apart is how little leaks there are between the stages.
Averaged across the seven markets, 81% of shoppers who know Amazon for BFCM consider it, 79% of those who consider it bought from it, and 82% of those who bought from it prefer it. For the best-selling rival in each market (Argos, Fnac, Kmart, MediaMarkt, Rakuten and Walmart), the same three steps are 67% (consideration), 54% (purchase) and 42% (preference). Australia is the exception at the top of the funnel, where Amazon is known by 69% and considered by 47%, but it still holds on to more of its shoppers through every step than Kmart does.
The chart below follows Amazon and each market’s best-selling rival from awareness to preference, and Amazon’s curve is the tighter one in every market.
Being known and considered doesn’t always make a retailer the first choice.
In the UK, 49% of Black Friday shoppers consider Currys, but only 5% prefer it. It’s a similar story for Best Buy in the US (43% vs. 4%) and MediaMarkt in Germany (48% vs. 7%).
The difference is even clearer when we look at purchases. Across markets, the leading local retailer is bought by 1.6 to 3 times as many shoppers as those who name it their favourite.
Amazon is a different story. In every market, its preference score is at least 72% of its purchase score, reaching 97% in Germany.
The takeaway? Being bought doesn’t necessarily mean being preferred.
Outside Amazon, few shoppers return to the same retailer every Black Friday. Among shoppers who know a retailer, just 9% in Japan to 16% in Canada see the average retailer as an annual Black Friday destination. Amazon’s score is 33 to 41% in most markets, with Australia the outlier at 24%.
The physical availability machine behind the brand
We asked Black Friday shoppers which of 13 qualities they associate with each retailer, from reliable shipping and ease of use to trust and value. Two things to keep in mind. Shoppers could pick more than one statement for each retailer, so “has the best deals” isn’t a preference, but it’s a strong sign of where shoppers see value. And the scores are among people who know each brand, so we also weight them by how many BFCM shoppers know it, which makes retailers with different reach more comparable. Four qualities stood out as most closely linked to retailer preference: easy to use, wide range of deals, best deals and reliable shipping.
These are also Amazon’s strengths. In the UK, US, Canada, France and Germany, Amazon leads local competitors across all four. Across the seven markets where Amazon is most preferred, its biggest advantage is reliable shipping, where it scores 20 percentage points higher than the strongest local competitor on average. But the gap isn’t the same everywhere. Amazon only leads on two of these associations in Japan and just one in Australia. The order of the race follows both: the closer a market’s locals get to Amazon on awareness, consideration and those four statements, the closer the race. Australia, the closest race, is also the one market where Amazon trails the best local retailer on both awareness (69% against 73% for JB Hi-Fi) and consideration (47% against 50%).
The chart below shows, in each market, the retailer with the highest score on each of the four statements.
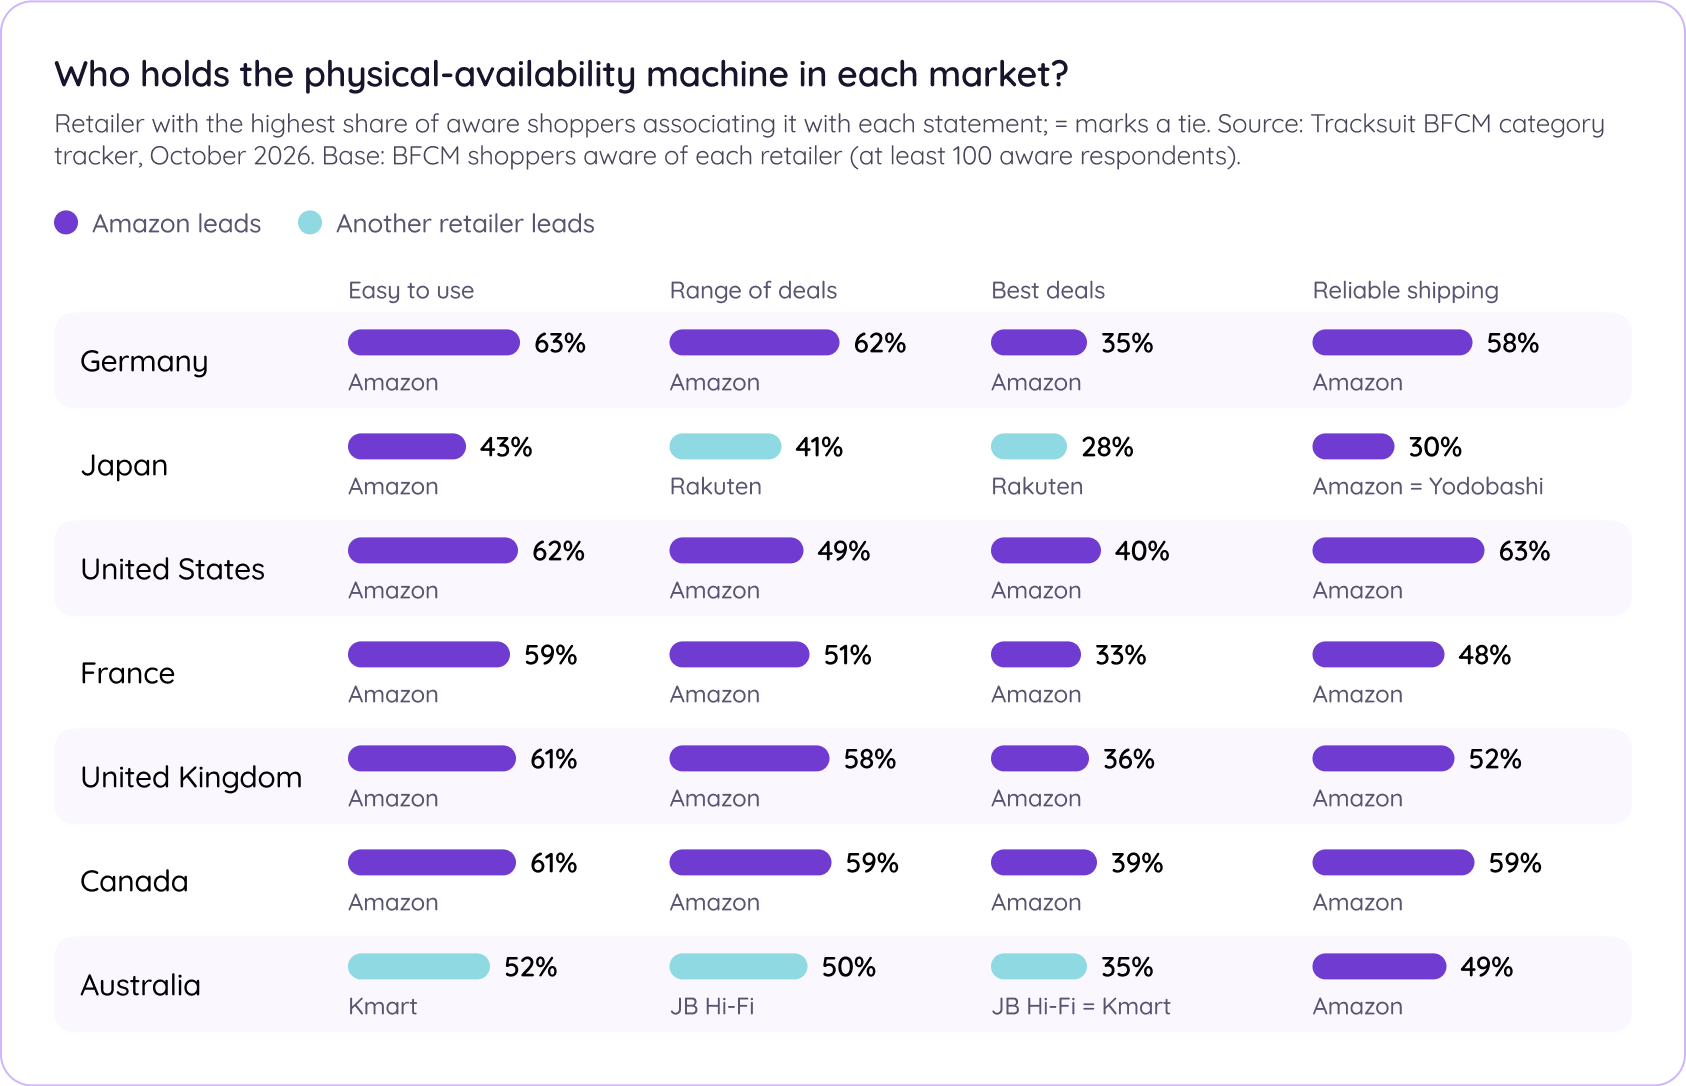
Put the physical availability machine next to the funnel and a pattern appears. Awareness and consideration, which together make up mental availability, line up closely with both purchase and preference across the markets and retailers, and so do the four statements about the experience of buying, which we treat as physical availability. What matters is having both. Retailers that perform well on both consideration and the four key qualities are more likely to win shoppers.
They average (median) 23% purchase and 13% preference, compared with just 5% purchase and 1% preference for retailers that perform poorly on both.
Amazon leads the way. It’s the most-preferred retailer in seven markets and tops awareness and consideration in six.
The lesson for challengers? Shoppers need to know you, consider you and have a reason to choose you.
Can local retailers compete with Amazon? The data suggests they can, but few have all the right ingredients. Walmart is level with Amazon on range of deals in the US (48% against 49%). Rakuten leads both deals statements in Japan, Otto is second only to Amazon on reliable shipping in Germany. The retailers in the second slot on preference, Walmart (19%) and Rakuten (19%), are the ones holding the most pieces. The takeaway? Local retailers already have some of what makes Amazon successful. The challenge is bringing those strengths together.
Trust is where the locals come closest. Among people who know them, another retailer is trusted more than Amazon in six of the seven markets. Weighted by how many BFCM shoppers know each brand, Amazon is level or ahead in all but Australia. In the UK it is ahead, though only just: 47% of BFCM shoppers both know Amazon and trust it, against 41% for M&S. Trust is shaped by many things beyond Black Friday, so this isn’t a BFCM-only read, but the contrast is worth noting: Amazon holds its own against retailers that, in many cases, have had far longer to earn it.
Temu and Shein have attention, not brand
The marketplaces headquartered in Asia have done something impressive in about three years: Temu is now recognized as a BFCM retailer by 43 to 59% of shoppers in the Western markets. But recognition hasn’t led to preference. Temu, Shein and AliExpress together hold between 2% (Japan) and 8% (UK) of first preferences.
The chart below compares Temu, Shein, Amazon and local retailers across every stage from awareness to preference, averaged across seven markets.
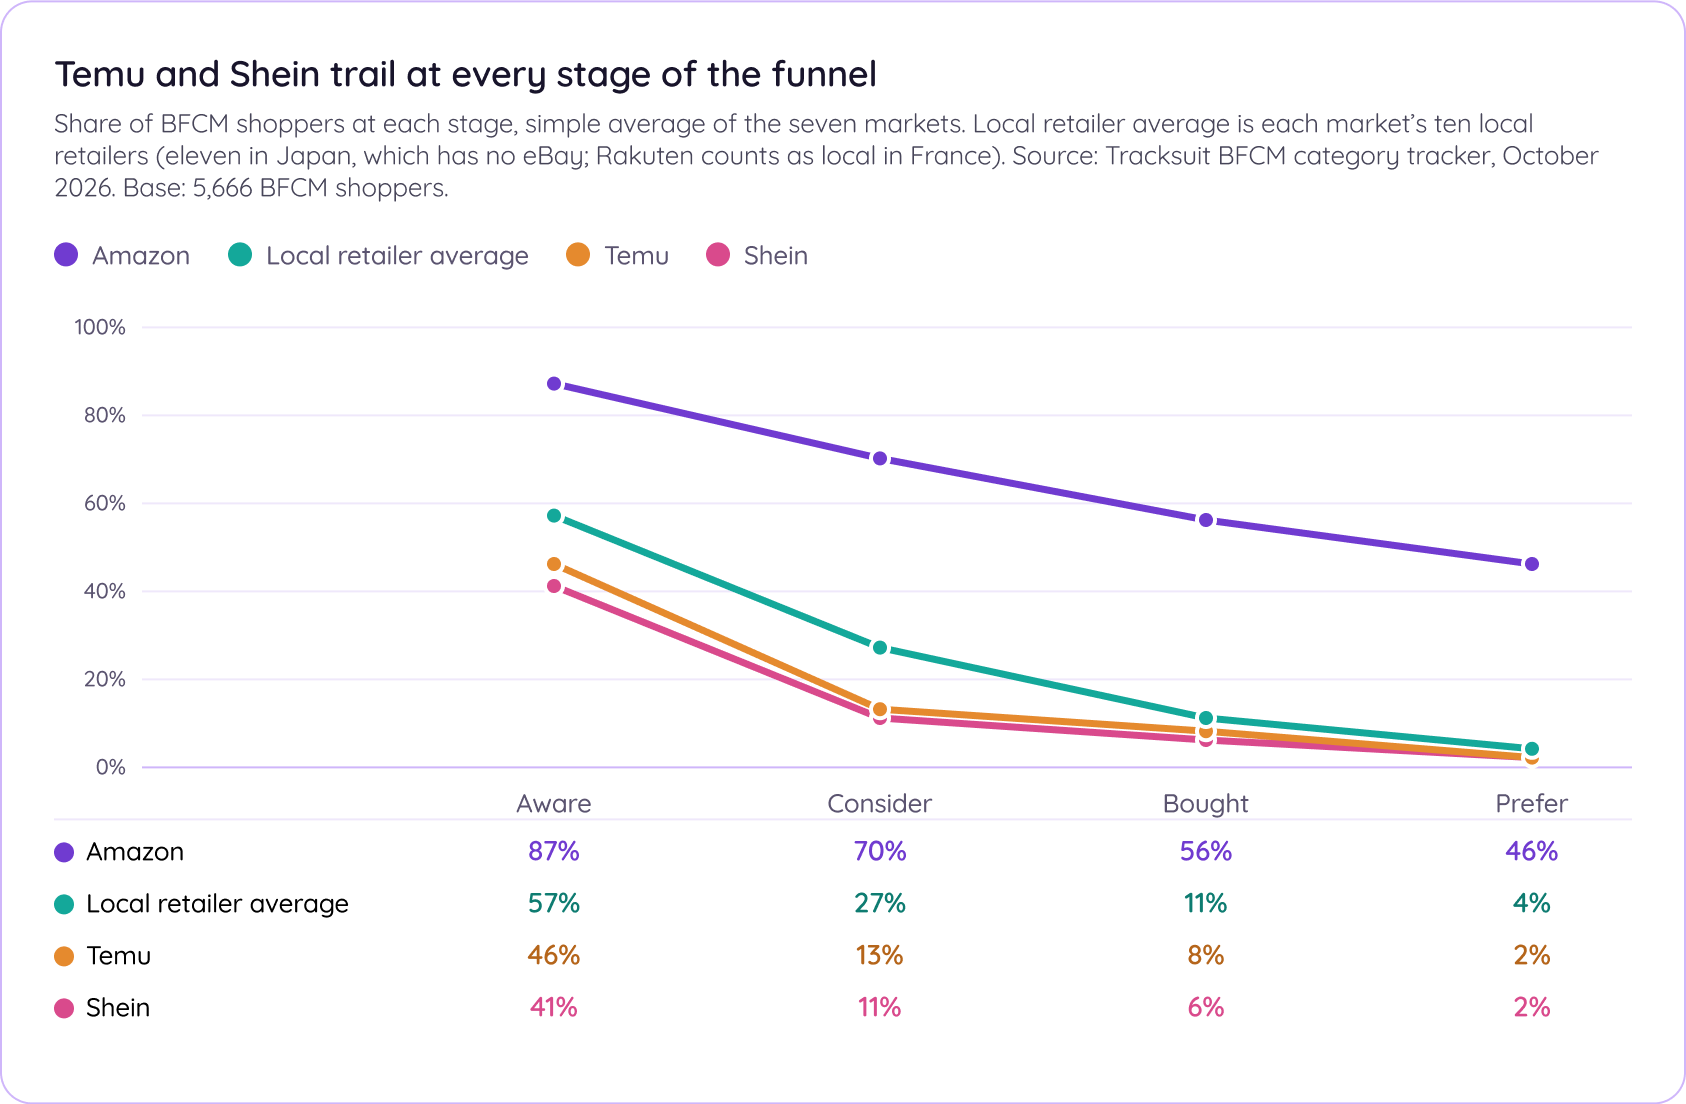
We also asked shoppers which statements fit each retailer, like “has the best deals” or “is a brand I trust”, counting only people who already know the brand. Set against the local retailers in each market, Temu and Shein are known for one thing: 39% call them affordable against 28% for the local retailers, ahead in all seven markets. They are level on “has the best deals” (17% against 16%) and behind on a wide range of deals (26% against 31%), easy to use (24% against 30%) and reliable shipping (15% against 20%).
Temu and Shein are also falling behind on awareness, consideration and trust.
On average, 44% of Black Friday shoppers know them, compared with 57% for local retailers. Just 12% consider them, compared with 27% for local competitors. And among shoppers who know them, only 11% associate them with trust, versus 34% for local retailers.
Even their low prices aren’t enough to close the gap. In the US, just 6% of shoppers know Temu and associate it with the best deals, compared with 26% for Walmart.
The takeaway? Getting attention is one thing. Turning it into trust, consideration and purchases is another.
How shoppers are heading into the sale
Most marketing plans for Black Friday and Cyber Monday are already locked and loaded, however understanding where shoppers’ heads are as the sale approaches can help you understand the playing field while the sales roll in. Three things stand out across the seven markets.
First, a lot of them have already decided who comes first. In Germany, Japan and the UK, at least half of BFCM shoppers name Amazon as the retailer they’d prefer to buy from (66%, 57% and 50%), and in the US, Canada and France it’s 40 to 44%. Australia (26%) is the open contest.
Second, they’ll buy from very few retailers. In every market the average shopper bought from fewer than 2.5 of the 15 major retailers we tracked, and from fewer than 1.6 in Germany and Japan.
Third, the retailers they prefer are strong on both counts: shoppers know and consider them, and associate them with being easy to use, having a wide range of deals, the best deals and reliable shipping. Retailers strong on only one of the two rarely get preferred.
What this means if you’re racing Amazon
Amazon’s funnel is what healthy brand building looks like in a sale: strong mental availability, backed by strong physical availability. The best-known challengers rarely lose at awareness. They lose between “I’d consider it” and “I bought it”, and again between “I bought it” and “it’s my first choice”.
With the sale peak about two weeks away there might not be time to overhaul your entire strategy, but some small adjustments can still go a long way. The same three moves came up in every market.
- Put certainty next to the discount (physical availability): reliable shipping is where Amazon’s lead is widest, so put delivery dates, stock availability and returns next to the offer where relevant.
- Be the second browser tab: most shoppers buy from only one or two major retailers, so there’s almost always a second basket, and the way into it is to be known and considered.
- Pick one piece of the machine you can prove and say it loudly: ease of use, a wide range of deals, the best deals or reliable delivery. Pair it with the mental availability you already have, so the shoppers who know you have a reason to choose you. Claims shoppers can see build preference, and preference is what forms repeat BFCM purchasing habits from year to year, so start building next year’s habit now.
Pages like this get revisited, so one last note for when you come back. This is the baseline wave. The numbers to watch as the sale passes are the gap between consideration and purchase for each retailer, and the share who call it an every-year destination. If those move, something the retail brands did is working. We’ll be back in early 2027 with a full three months of data and the definitive read on how Black Friday 2026 played out.
Methodology
In October 2026 Tracksuit surveyed 10,442 adults across seven markets. Respondents qualified as BFCM shoppers if they said they had bought in a Black Friday or Cyber Monday sale in the past 12 months or were open to buying in this year’s sale; 5,666 did, which is 54% of respondents. Unless stated, results are shares of the BFCM shoppers in each market, rounded to whole numbers, so totals and differences may not add exactly.
BFCM shoppers rated 15 major retailers in their market on four measures: awareness (recognising the retailer as a BFCM retailer), consideration (would consider buying from it), bought (bought from it in last year’s BFCM, with as many choices as they liked) and preference (the one retailer they would most prefer to buy from this BFCM). Conversion between stages, such as “68% of the people who know Amazon for BFCM consider it”, divides one stage by the one before, using each stage’s share of all BFCM shoppers.
Retailers per shopper adds each market’s purchase rates across the 15 retailers, and a retailer’s share of purchases is its purchase rate divided by that total.
Brand perception statements are asked of people aware of each brand: they chose which of 13 short statements fit each retailer, and could choose more than one statement for each retailer, so statement scores are shares of aware shoppers and are not a preference measure. Where we weight statements by awareness, we multiply the share of aware shoppers choosing a statement by the share of BFCM shoppers who know the retailer, and show the result as a share of all BFCM shoppers, so that the share of the population who hold each view is more evident. Statement results are used only for retailers with at least 100 aware respondents.
Brand statements and preference: we used Spearman’s rank correlation to identify the strongest connection points between the brand statements and the funnel metrics. For each retailer in each market, we compared the share of aware shoppers who associate it with each statement, along with its awareness and consideration, against its preference and purchase scores (the share of BFCM shoppers who bought from each retailer last BFCM), across the 101 retailer-and-market pairs with at least 100 aware respondents.
The Temu and Shein comparison averages Temu and Shein within each market against the average of the ten local retailers (the 15 less Amazon, eBay, Temu, Shein and AliExpress, which leaves eleven in Japan, where eBay isn’t surveyed; Rakuten counts as local in France), then averages across the seven markets, using statements only where at least 100 people were aware of the brand.
Each retailer appears once per market and the pairs aren’t fully independent, so the figures describe the pattern rather than test for cause. Retailer groups: the 15 major retailers in each market are grouped by category and headquarters. Marketplaces are split into global marketplaces headquartered in the US (Amazon, eBay), marketplaces headquartered in Asia (Temu, AliExpress, Shein and, in France, Rakuten) and local marketplaces (Cdiscount in France; Rakuten and Yahoo! in Japan). The other groups are fashion (ASOS, Zalando and ZOZOTOWN), beauty (Sephora, Ulta Beauty, Douglas, Matsumoto KiYoshi), electronics and appliances, general merchandise, grocery, department stores, home improvement, home and furniture, warehouse clubs, sports, and office and tech. Each market post lists its own groups.
Population equivalents apply each market’s rounded engagement rate to the UN World Population Prospects 2024 (medium variant) estimate of the population aged 18 and over at 1 July 2026.
This is the first wave of a tracker that will run through the sale, so treat it as the starting line.
AI was used to support ideation and iteration of this analysis. All data points and observations have been refined and validated by Tracksuit’s Marketing Science team.